MANA coin price surpasses the 200-day EMA as the buying pressure grows phenomenally resulting in the $2.45 level breakout. Key technical points:
- MANA coin price approaches the $2.5 mark.
- In addition, the price resurfaces above the 200-day EMA.
- The 24-hour trading volume of Decentraland is $766 Million, marking a 127% rise.
Past Performance of MANA
MANA coin price shows a bullish breakout of the consolidation range near the $2.30 mark resulting in a spike above the $2.45 horizontal level. However, the meta coin faces selling pressure near the $2.50 psychological mark resulting in a retracement to retest the bullish breakout. 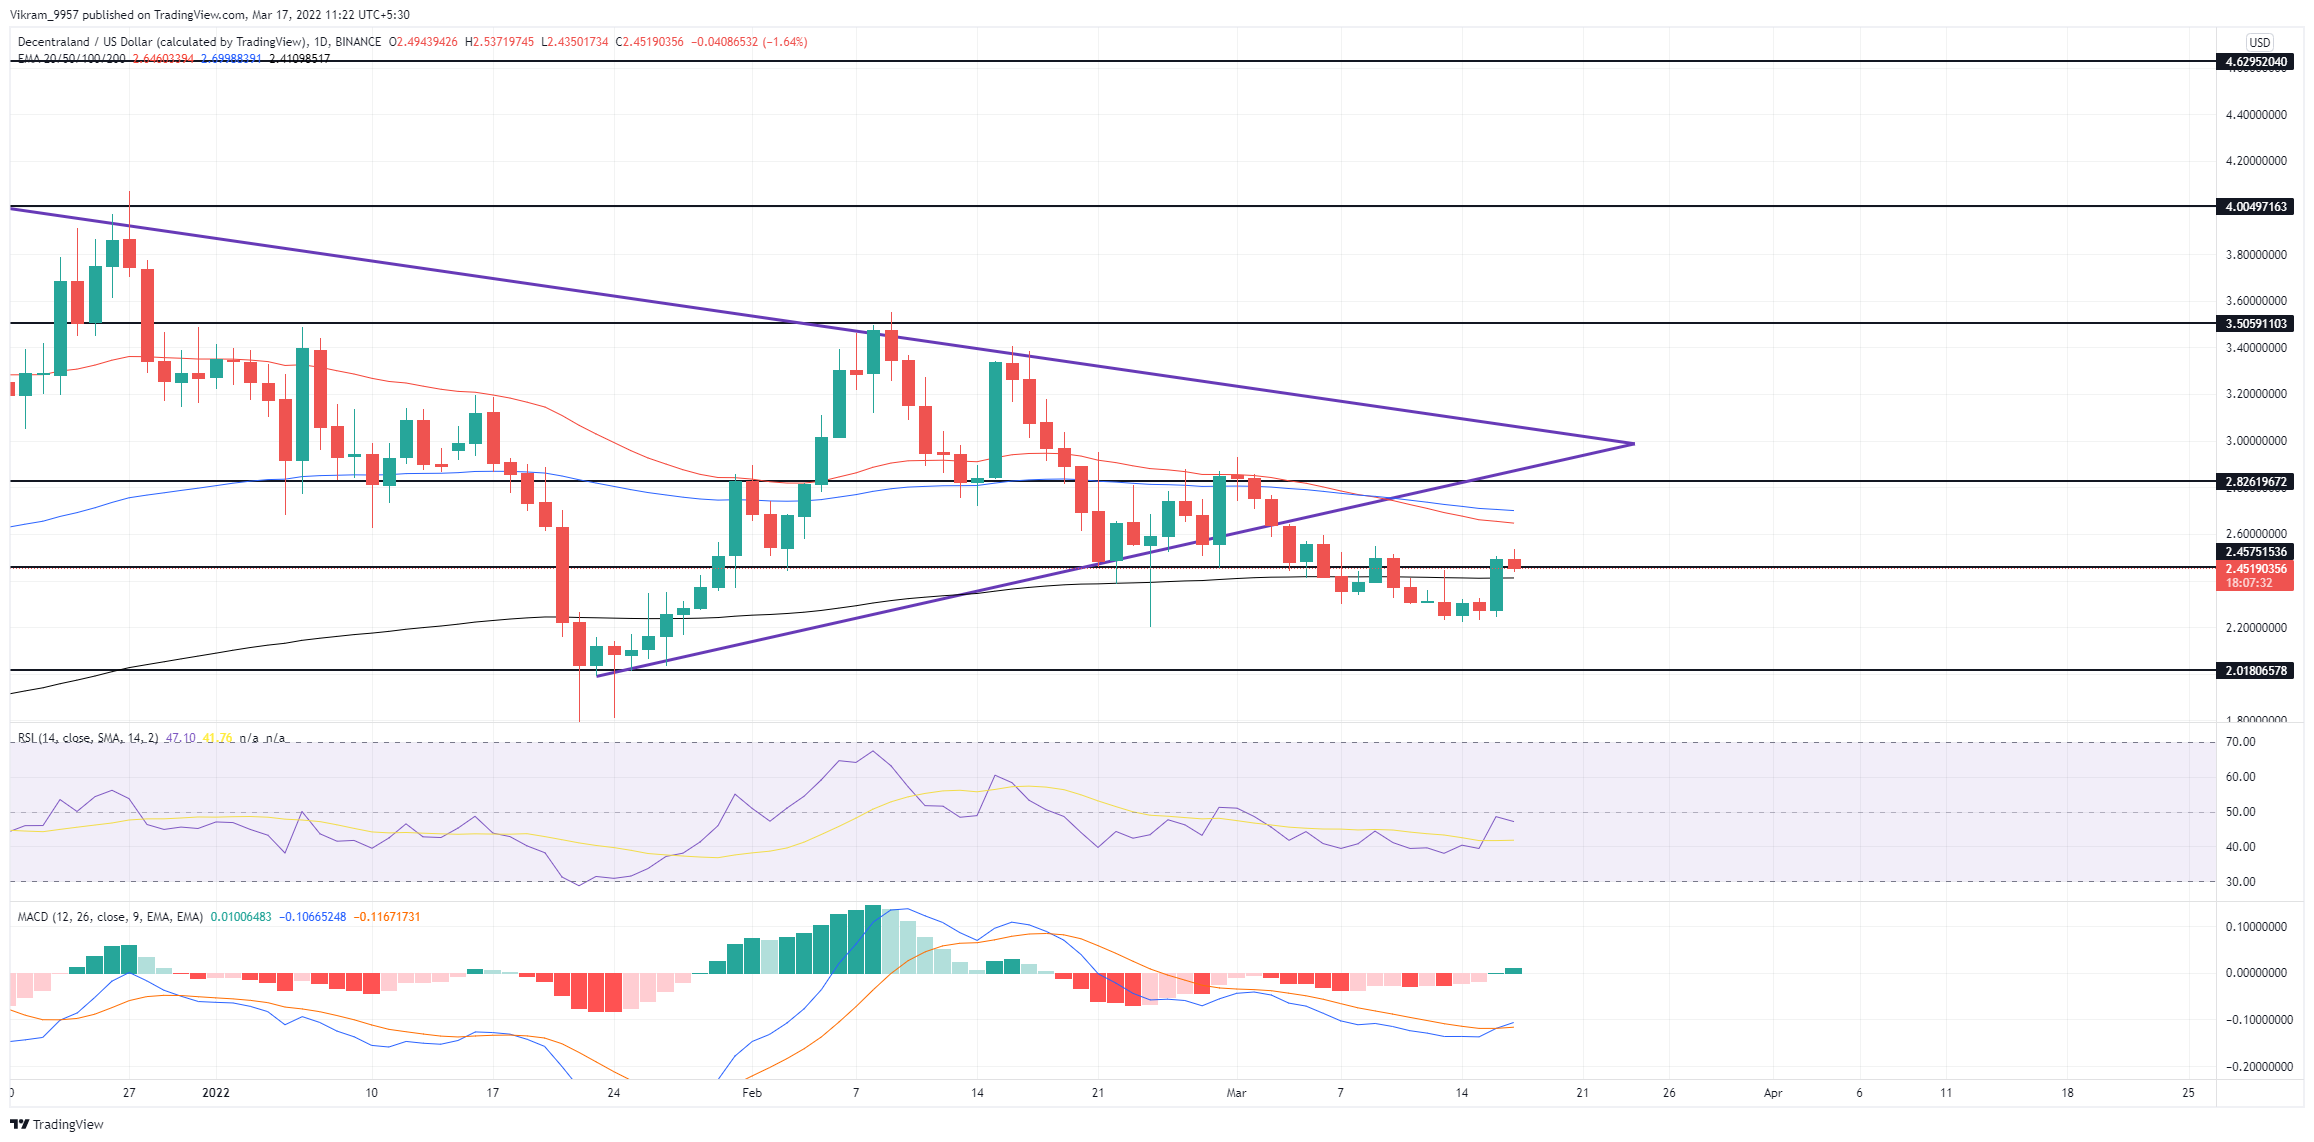 Source-Tradingview
MANA Technical Analysis
MANA coin price rises above to retest the broken triangle pattern as buyers sabotage the downtrend and bring a potential bullish reversal rally. However, the rally must surpass the psychological barrier at $2.5 to continue the bullish rally. The altcoin surpasses the 200-day EMA while the 50 and 100-day EMA struggles to achieve a bearish spread as the trend reverses. However, the rally faces bearish tension from the diverging EMAs opposing the bullish growth. RSI Indicator: The RSI slope faces objection from the 50% mark resulting in a sharp reversal in the uptrend slope. Hence, the indicator reflects the high selling pressure present above the $2.60 mark. MACD Indicator: The MACD and signal lines give a bullish crossover and startS the positive trend in the MACD histograms. Hence, the indicator shows a jump in underlying bullishness. In a nutshell, the MANA technical analysis shows a bullish projection that may shortly surpass the bearish EMAs.
Upcoming Trend
MANA coin price gains bullish attention, resulting in the consolidation breakout that may surpass the $2.5 psychological barrier shortly. The rally could result in a price jump to the $3 mark. First, however, the price action confirmation is a must for the bullish entry spot. Conversely, closing below the 200-day EMA will nullify the uptrend probability resulting in a retracement to the $2.30 mark. Support Levels: $2.40 and $2.30 Resistance Levels: $2.5 and $3