The situation on the ALICE market is quite unpleasant and uninspiring. Unfortunately, February did not benefit investors and the price recovery. In the weekly timeframe, we see that all attempts by buyers to impose a struggle end in closing the weekly candle below the opening price and big pins up. The local initiative of sellers, supported by the black trend line from March 2021, is still unbreakable. At the same time, trading volumes remain corrective and even close to those that were during the active phase of ALICE growth in August 2021. The nearest price zone that can stop this powerful wave of fall is in the range of $4.8. Starting from this mark, the fall wave slowed down in May 2021. Yes, this mark could not withstand the pressure and the price went down for a while. 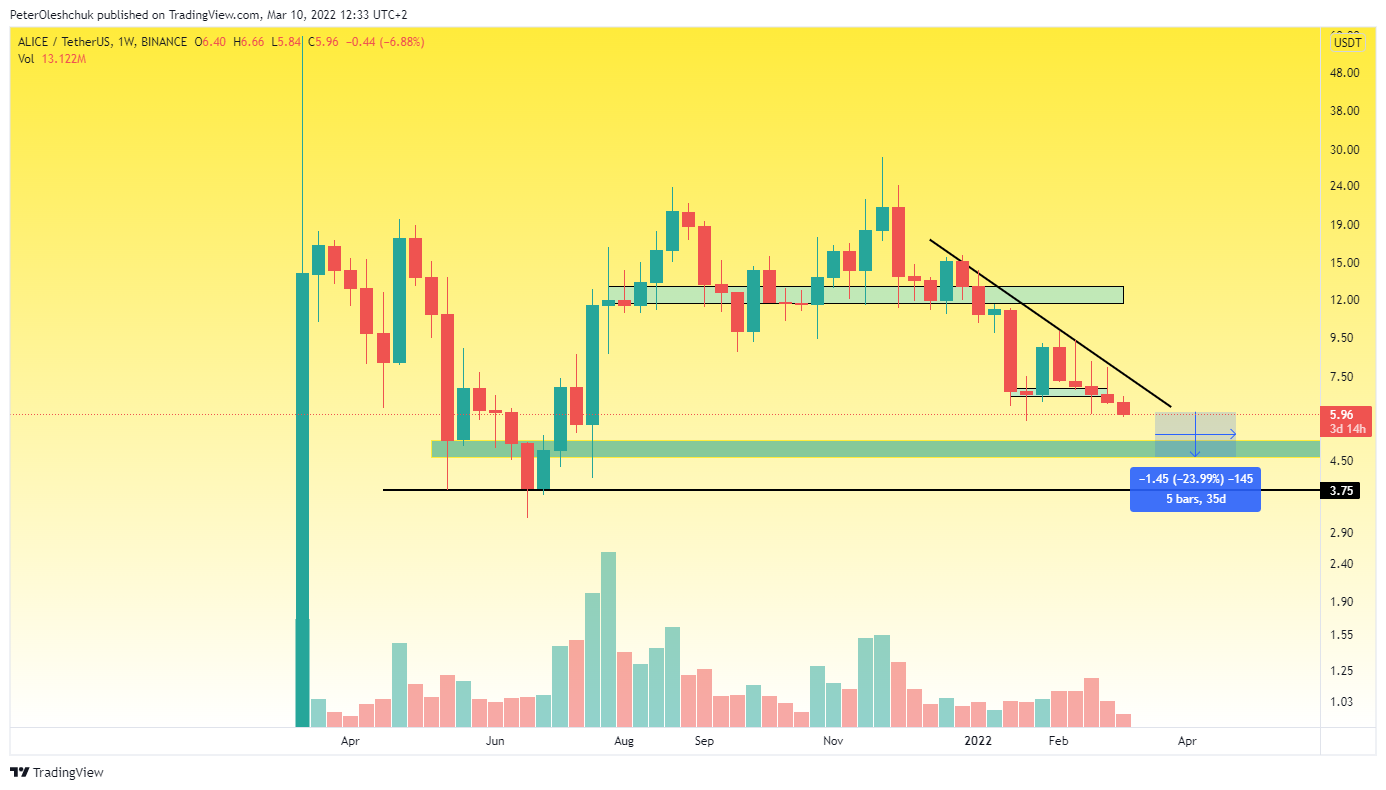 https://www.tradingview.com/x/74qkddNj/ However, it was in the range of $4.8 that the set of buyers' positions for the new growth wave began. In principle, if you look globally, the zone of accumulation of buyers' positions was in the wide range of $4.8-$7. Therefore there is a high probability of stopping the ALICE price fall earlier. Given this fact, the high probability of the price falling to $4.8 will be when the BTC price falls in the range of $30,000. Thus, the global set of positions in the ALICE cryptocurrency can already begin.
Technical Analysis Of ALICE On The Daily Timeframe
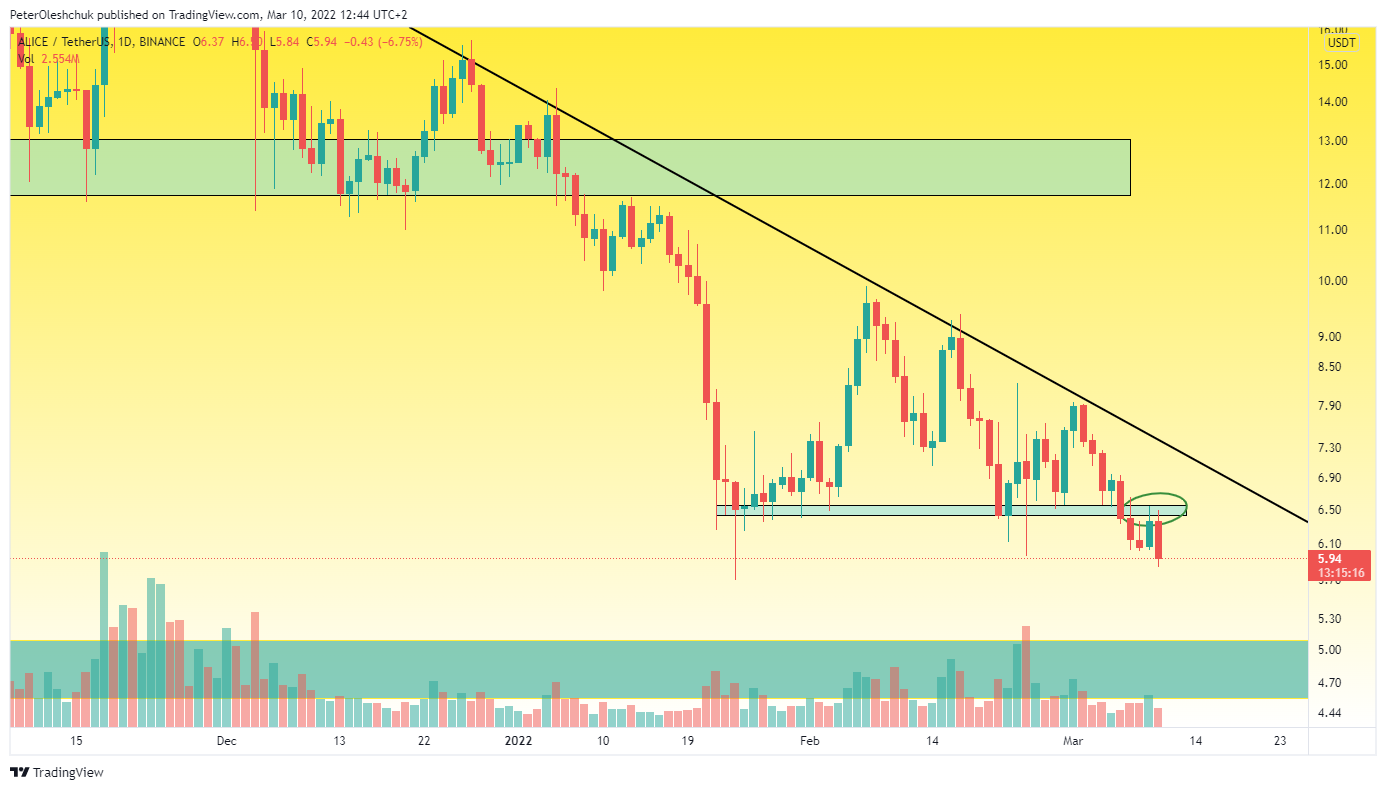 https://www.tradingview.com/x/Hm8ip5hz/ Analyzing the ALICE price movement on the daily timeframe, we see that buyers have missed their local chance to form the growth wave. If from the end of January 2022 buyers kept the range of $6.5, then from 6 March it passed into the hands of sellers. The daily candle from 9 March showed that at the moment buyers do not have the strength to fight. After testing the $6.5 bottom-up test, the next March 10 daily candles immediately and easily closed the previous candle. Therefore, the best scenario that can happen now in the ALICE market is to start consolidating below the $6.5 mark for another attempt to take control of this mark. But, if other cryptocurrencies are analyzed, not all allowed the previous daily candle (eg XRP) to be blocked by the March 10 daily candles. So, for now, ALICE looks like a weak cryptocurrency that should not be entered until there are increased trading volumes.
The ALICEBTC Price Is Moving To Historic Lows
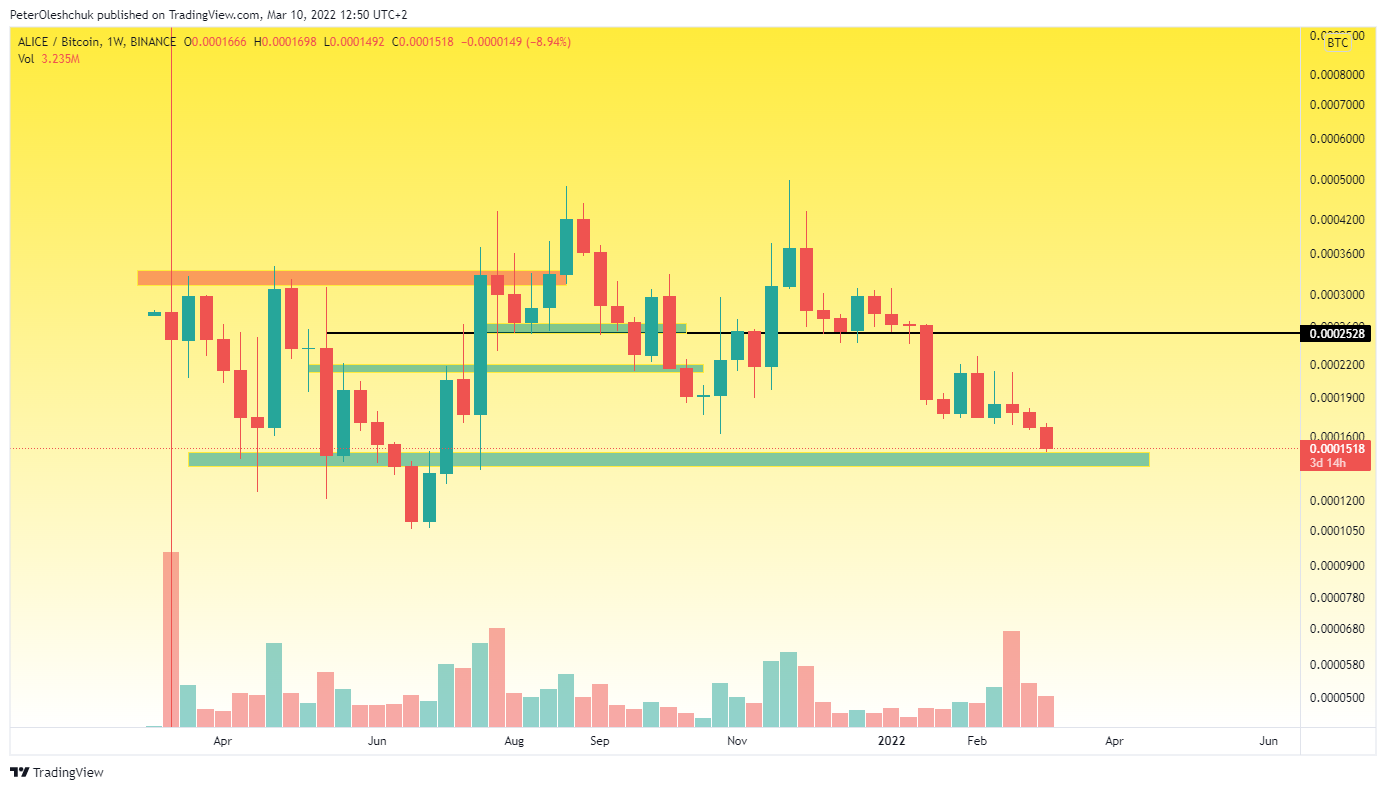 https://www.tradingview.com/x/5ypHnMQz/ However, not everything is as pessimistic as it looks on the ALICEUSDT chart. Looking at the ALICEBTC chart, I can see that the price is approaching a strong liquidity zone of 0.00014. Near this liquidity zone, buyers perfectly slowed down the global price fall in April and May 2021. Therefore, if over the next few weeks we see a slowdown in the ALICEBTC fall wave near 0.00014, this will be a good signal to expect a new growth wave with the first target of 0.00019. In case of complete passivity of buyers in the given range of updating of a historical low- will become our basic scenario.