Bitcoin traded as high as $9,377 before starting a downside correction against the US Dollar. BTC is currently up holding the $9,200 support and it could continue to rise steadily.
- Bitcoin is trading in a positive zone above the $9,200 and $9,180 support levels.
- The price is likely to resume its upward move above the $9,300 and $9,320 levels.
- There is a key bullish trend line forming with support near $9,250 on the hourly chart of the BTC/USD pair (data feed from Kraken).
- The bulls are likely to aim a fresh monthly high above the $9,400 level in the coming sessions.
Bitcoin Price Could Test $9,500
Yesterday, there was a decent upward move in bitcoin above the $9,200 resistance against the US Dollar. BTC even surged above the $9,300 level and the 100 hourly simple moving average.
A high was formed near $9,377 before the price started a downside correction. The price declined below the $9,320 and $9,300 support levels. However, it remained well bid above the $9,200 level and the 100 hourly SMA.
A low is formed near $9,205 and the price is currently rising. It broke the 23.6% Fib retracement level of the recent downside correction from the $9,377 high to $9,205 low. On the upside, the $9,300 level is once again acting as a resistance for the bulls.
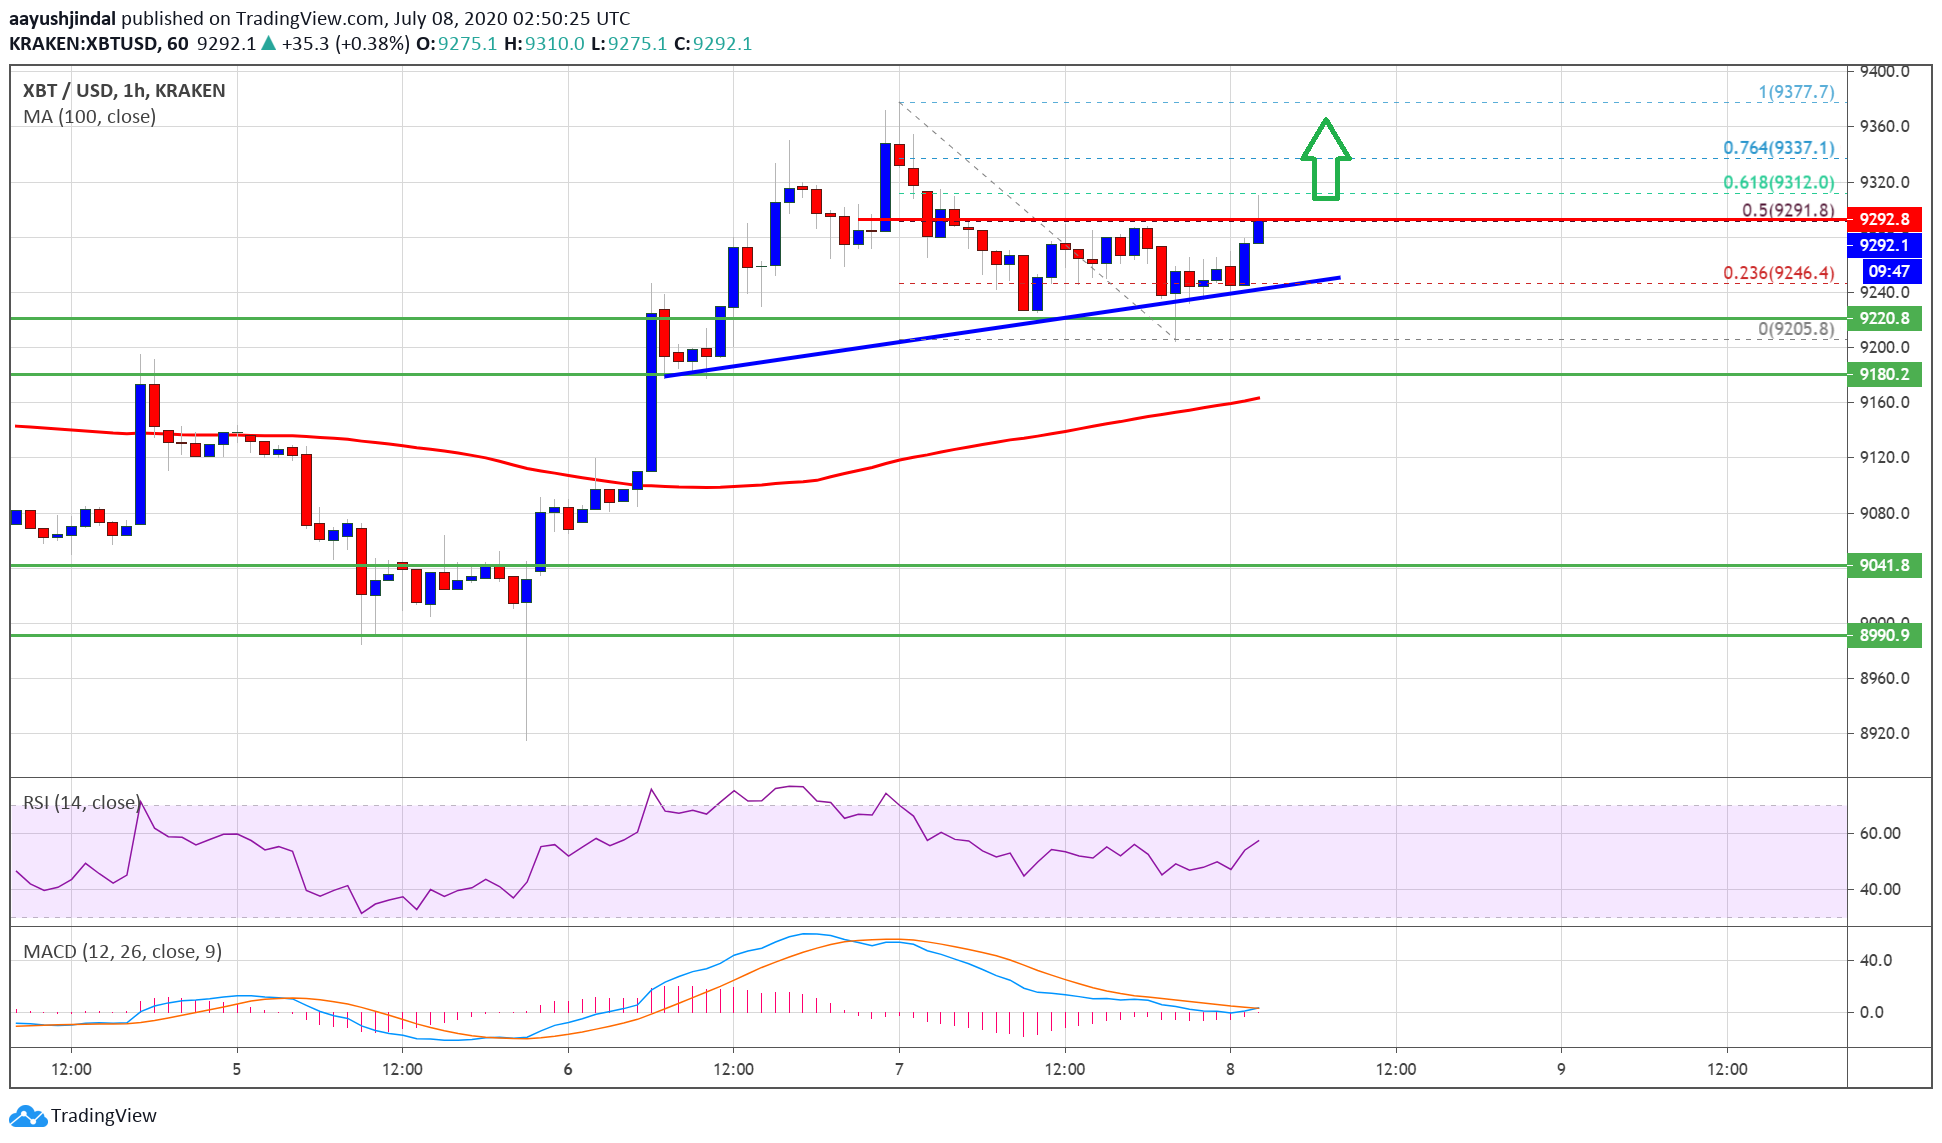
Bitcoin price holding $9,200: Source: TradingView.com
The 50% Fib retracement level of the recent downside correction from the $9,377 high to $9,205 low is also preventing more gains. It seems like there is a key bullish trend line forming with support near $9,250 on the hourly chart of the BTC/USD pair.
If the pair continues higher above the $9,300 and $9,320 levels, it is likely to break the $9,377 high and target a new high. The next immediate resistance is near $9,400, above which the bulls are likely to aim a test of the $9,500 level in the near term.
Bearish Reaction in BTC
On the downside, the trend line support is a major buy zone, followed by the $9,200 support zone. If the price fails to stay above $9,200, it could test the 100 hourly SMA.
Any further losses below the 100 hourly SMA or the $9,150 level could push the price back towards the $9,000 support level in the near term.
Technical indicators:
Hourly MACD – The MACD is slowly moving into the bullish zone.
Hourly RSI (Relative Strength Index) – The RSI for BTC/USD is currently rising towards the 60 level.
Major Support Levels – $9,250, followed by $9,200.
Major Resistance Levels – $9,320, $9,400 and $9,500.