- Bitcoin 10-day realized volatility reaches 20 percent for the first time since November 2018, according to data collected by Skew.
- The dip follows the cryptocurrency’s sideways consolidation moves in a narrow trading range across the last two weeks.
- Skew alerted the current volatility levels risks a “great sell-off,” citing a similar downside move from the November 2018 fractal.
Bitcoin’s 10-day realized velocity became the quietest in eighteen months on Monday as it retested levels last seen in November 2018.
Readings on the BTCUSD 10-day Impending Volatility dropped to 20 percent, according to blockchain data analysis firm Skew. Meanwhile, the 3-month volatility fell to 64 percent, its lowest this year.
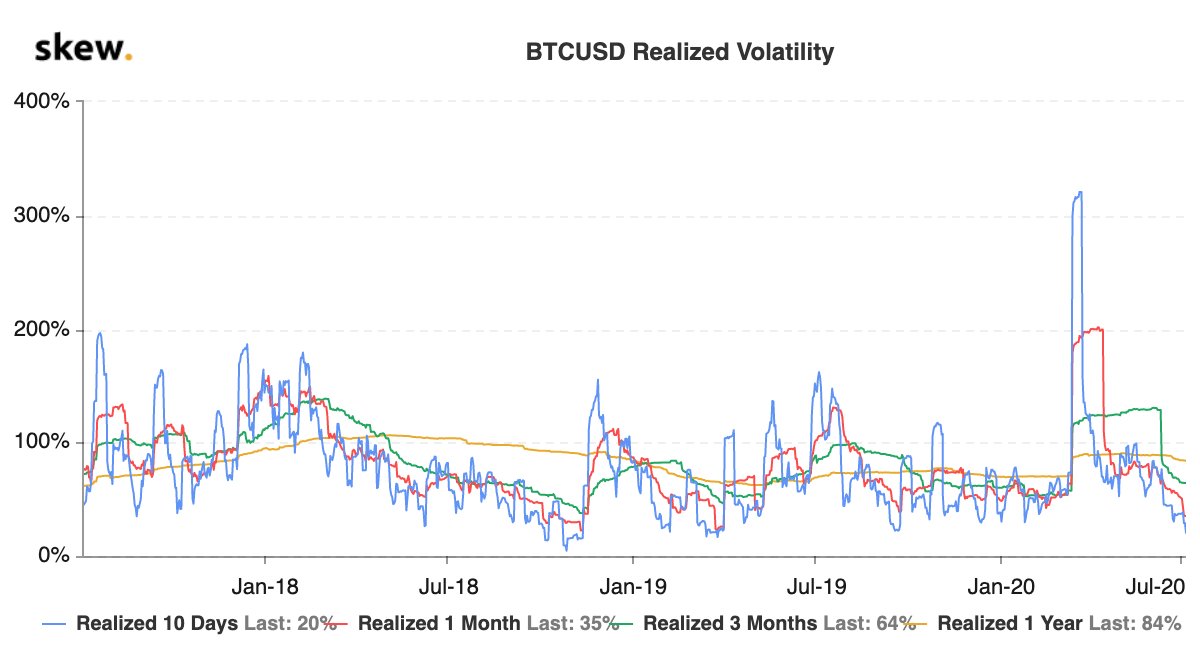
Bitcoin Impending Volatility chart. Source: Skew
At its highest, the 10-day Impeding Volatility was above 300 percent in March 2020. But now, the major decline in volatility points to a lack of clear directional bias – bullish or bearish – in the market.
Bearish Fractal
Bitcoin rose by more than 150 percent in the last three months leading up to the second-quarter close. The period of uptrend also saw the cryptocurrency failing to breach above a technical resistance area of $10,000-10,500.
At the same time, its downside bias remained capped by reliable support above $8,600-9,000 area.
The range is getting narrowed further in the last two weeks. As of late, the BTCUSD exchange rate has been unable to sustain its bullish bias above $9,400. Meanwhile, it has also failed to break bearish below $9,000.
A prolonged period of low-volatility typically leads to a significant price move in either direction. The longer the price consolidates, the more violent is the breakout – be it bullish or bearish.
But the circumstances around the 10-day Impending Volatility hitting its 18-month low points to a bearish move ahead, noted Skew. The portal reminded that the period of low volatility between September 2018 and November 2018 later led to a bearish breakout. As a result, the bitcoin price fell by more than 50 percent.
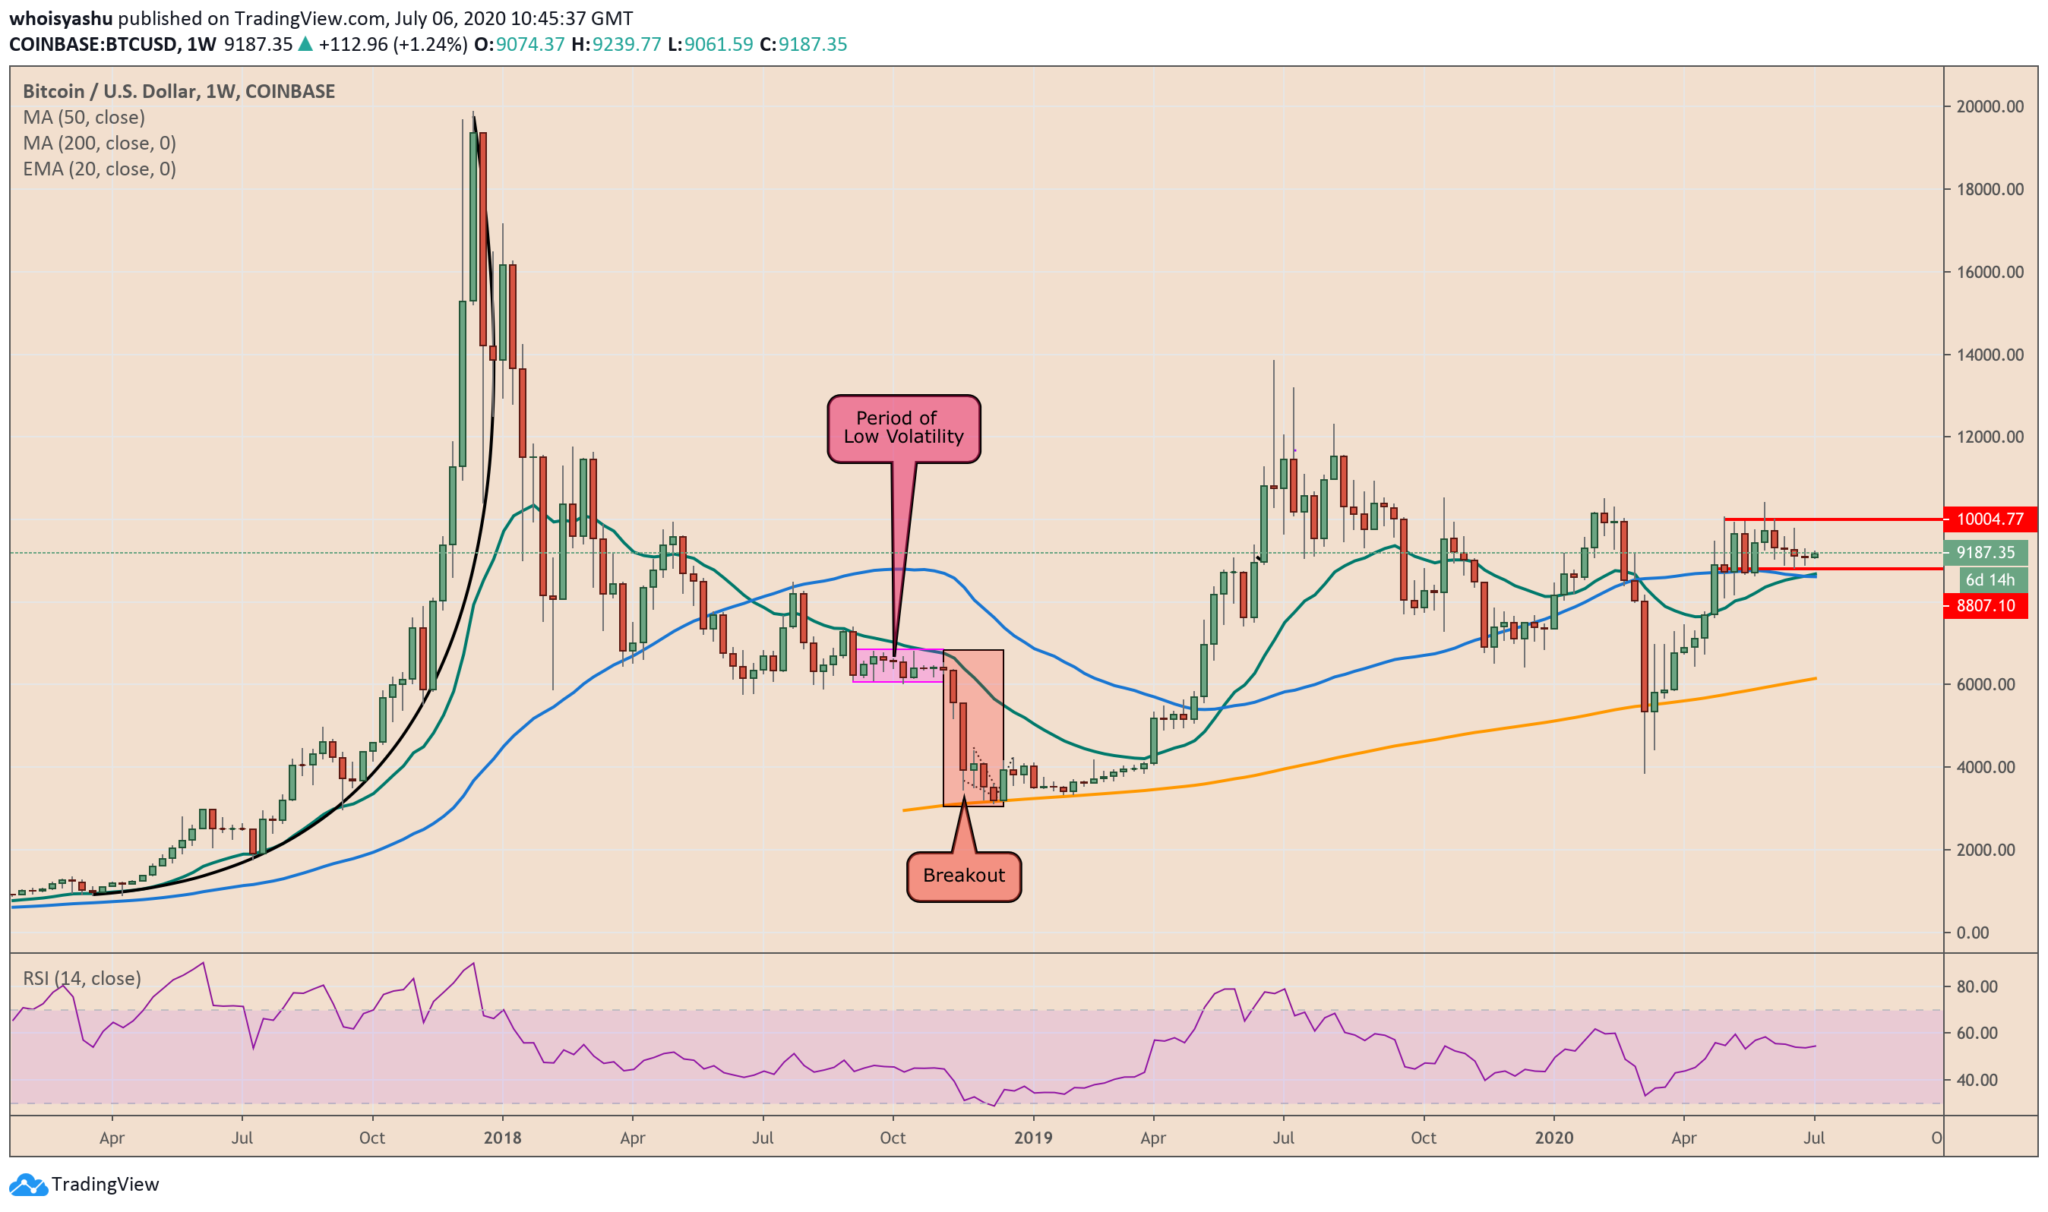
Bitcoin 10-day Implied Volatility resulting in a breakdown in November 2018. Source: TradingView.com
“Last time we reached that level, we had the great sell-off of November 2018 shortly after,” noted Skew.
More Bitcoin Bearish Theories
The leading technical indicators point towards an imminent bearish correction on the daily chart. For instance, Bitcoin has just printed a Death Cross pattern between its 20-day moving average and 50-day moving average. Its occurrence – historically – hints a sell-off in the market.
On the other hand, the cryptocurrency is also under pressure of a 3-year old descending trendline that is keeping it from attempting a full-fledged breakout.
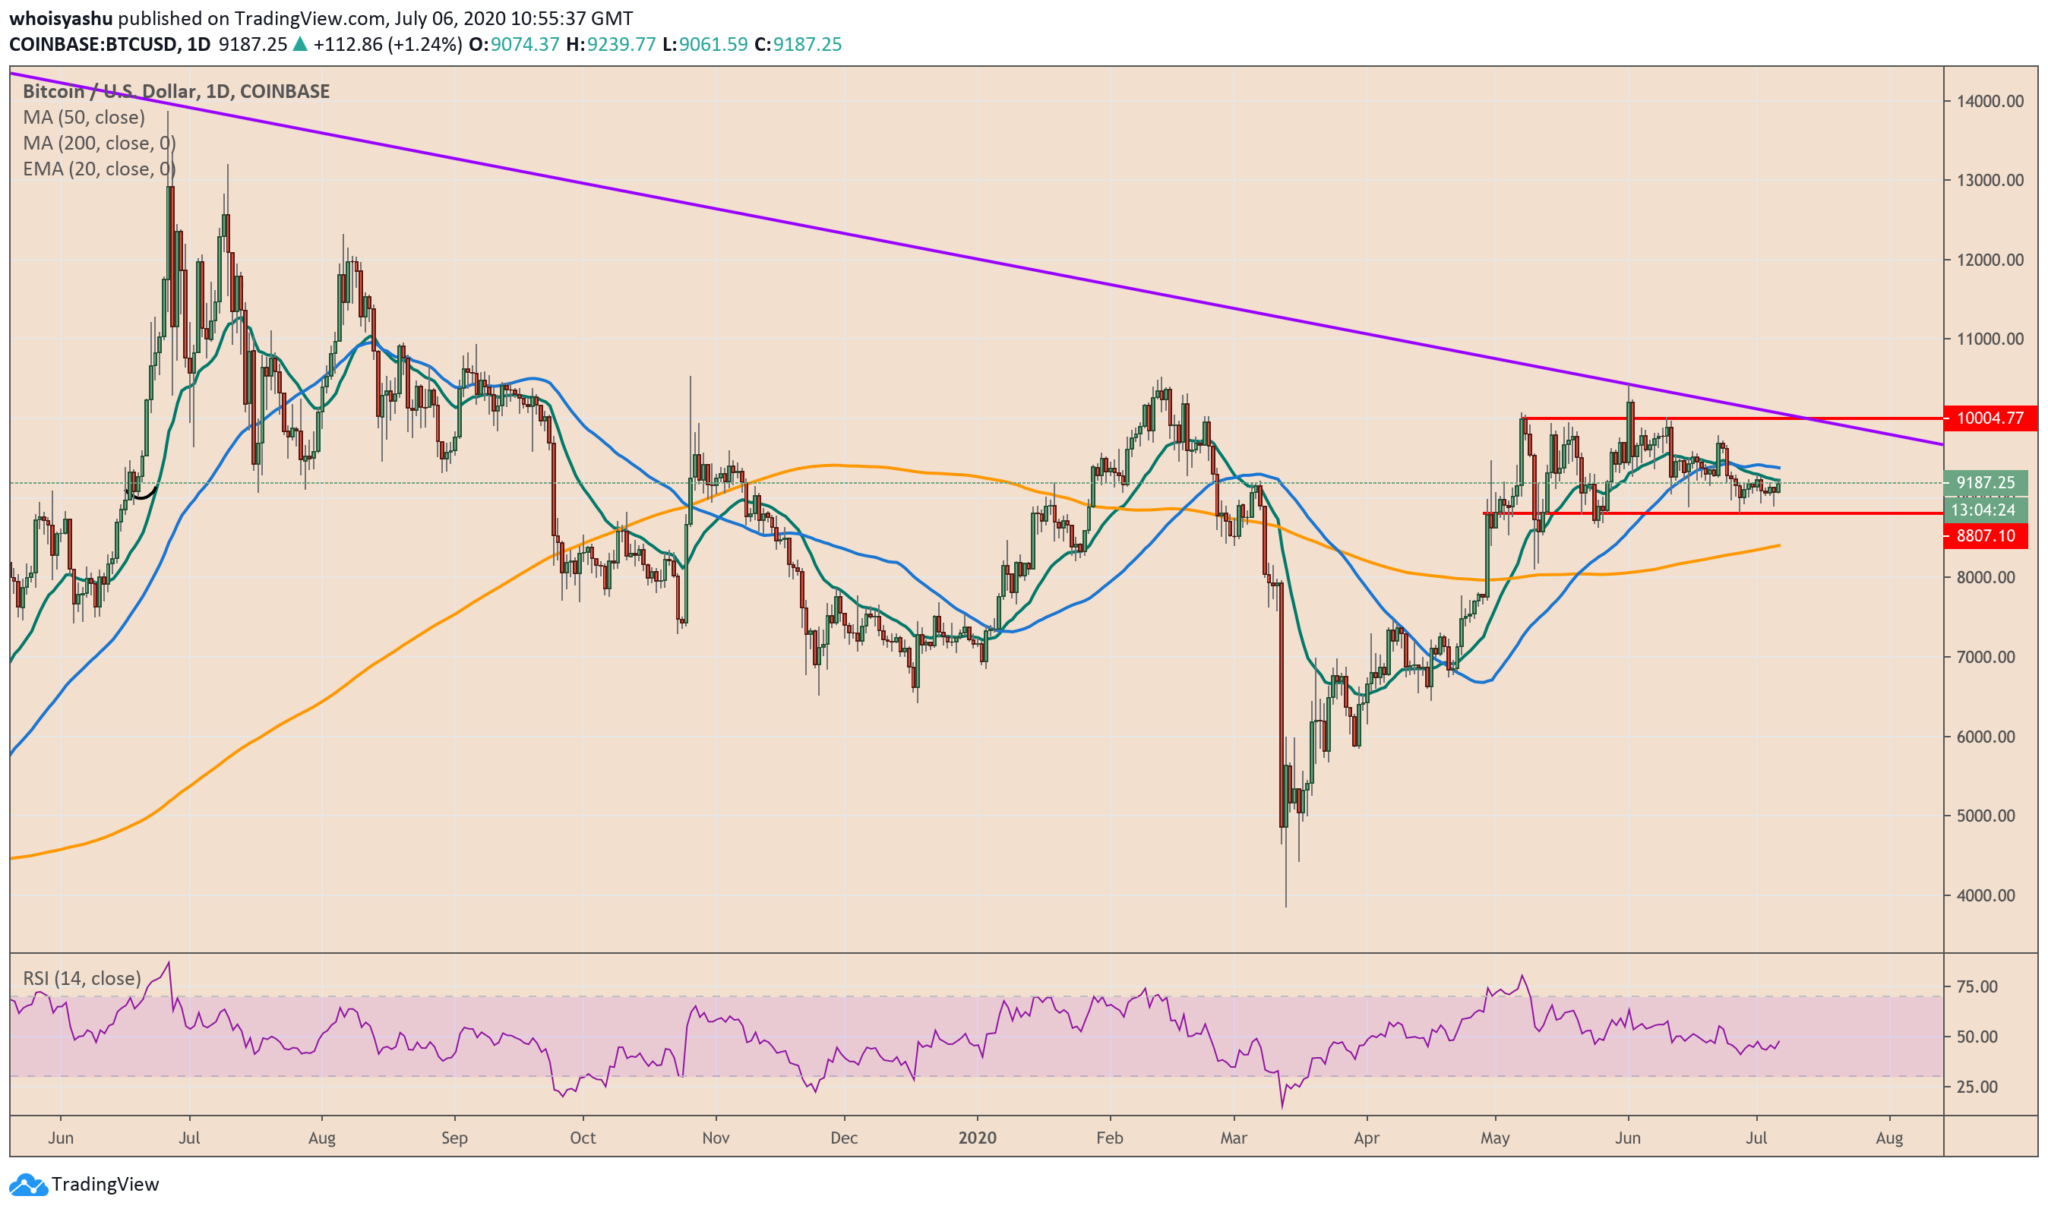
Bitcoin price trending below the giant descending trendline. Source: TradingView.com
While bitcoin may keep correcting lower under the influence of bearish indicators, its likelihood of attempting a strong pullback from $8,000-8,600 area is also higher. The range coincides with the 50-week moving average in the BTCUSD weekly chart above.
The same chart has also printed a Golden Cross between 20-DMA and 50-DMA. Its occurrence has mostly led the bitcoin price higher.
Photo by Amirali Mirhashemian on Unsplash