Bitcoin has spent the last two months trading in a tight range between $8,500 and $10,000. Prices have barely deviated from these boundaries, save for minor deviations that were quickly corrected.
Some say that this consolidation is a “launchpad” for the bull market. Yet the argument that Bitcoin’s recent price action is the cryptocurrency topping recently gained strength with a new analysis.
Related Reading: U.S. Congressman Davidson Says Bitcoin Is “Required to Defend Freedom”
Bitcoin Prints “Major” Warning Signs as Price Falters
Over the past few weeks, there have been many analysts drawing lines between Bitcoin’s recent price action and textbook distribution patterns. While BTC is an asset that often moves irrationality, it still abides by the rules of technical analysis, they suggest.
One trader recently shared the chart below, showing that there are a “couple more clues” suggesting high time frame distribution:
“A couple more clues developing that lend themselves to HTF distribution. 1. Rising Demand on the verge of failing. 2. Side by side, ascent vs descent with selling the dominant pressure from volume.”
His analysis led him to the conclusion that a drop under $7,000 could take place. He went as far as to say that a move “much lower” than that pivotal level may take place.
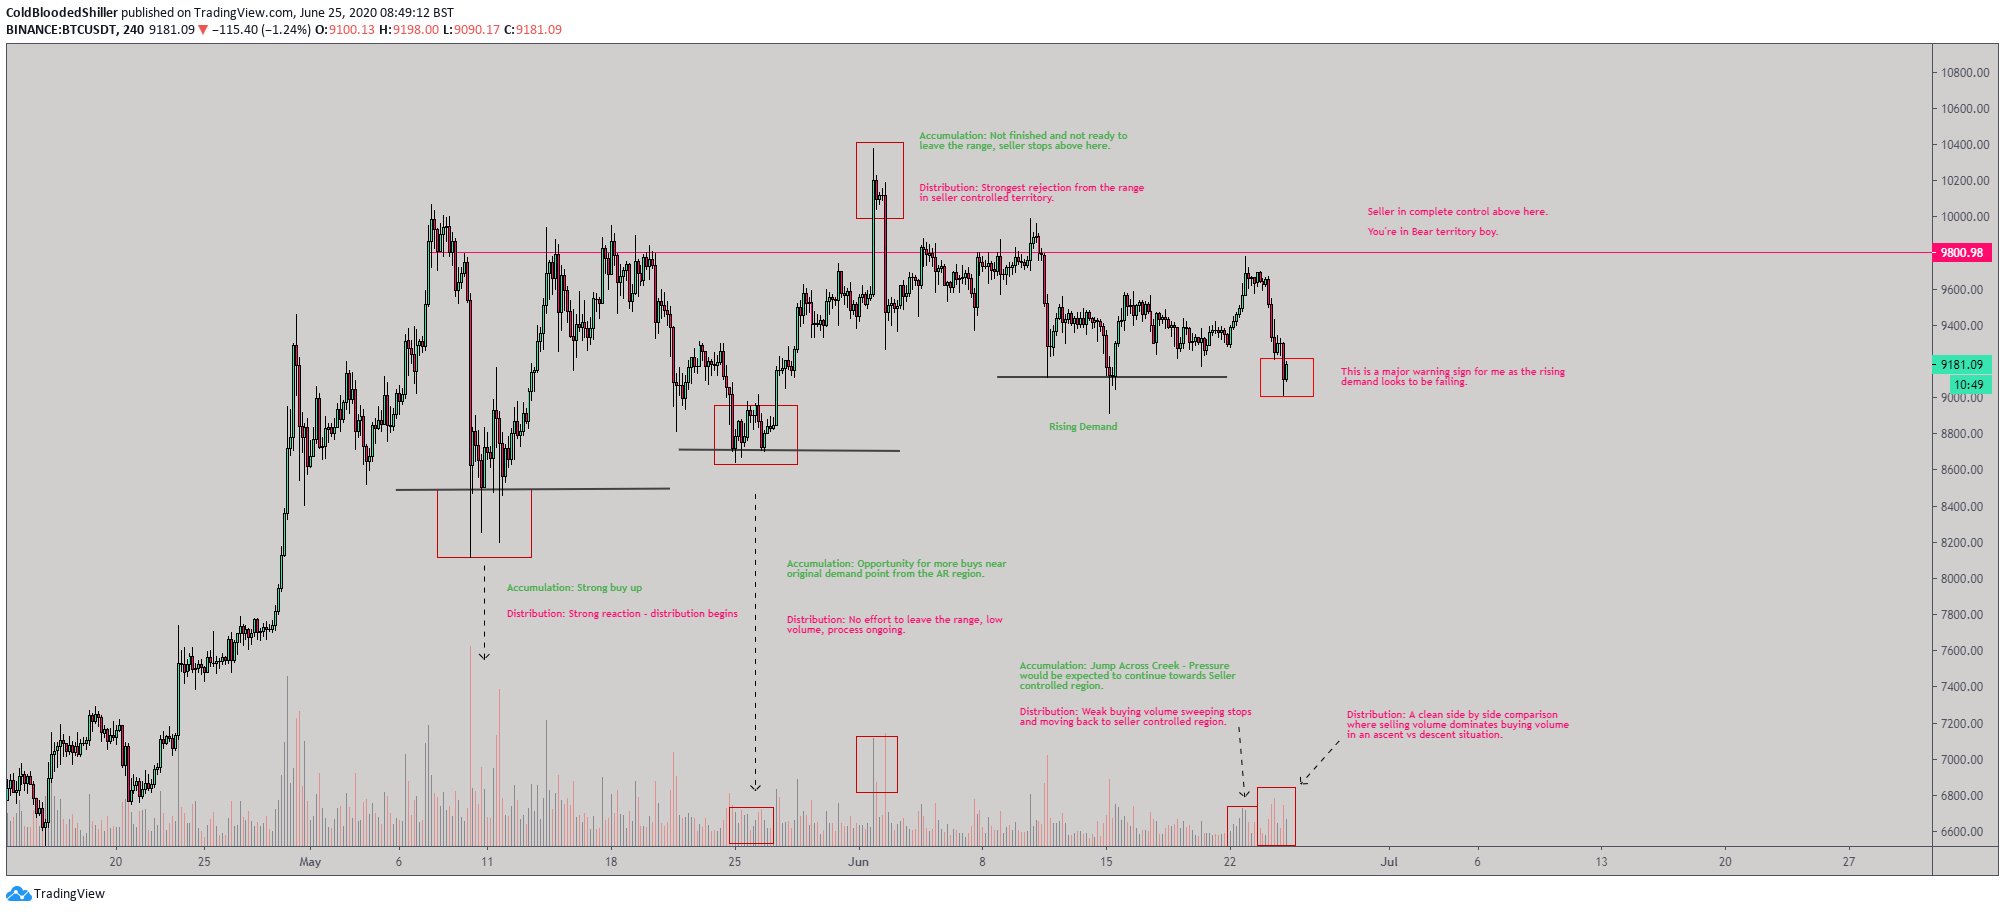
Bitcoin distribution analysis shared by trader "Cold Blooded Shiller" (@Coldbloodshill on Twitter). Chart from TradingView.com
Related Reading: If Bitcoin Traders Short Here, They Have “Terrible Odds” Of Making Money: Analyst
Far From the Only Sign
Other indicators and metrics also suggest an imminent decline in the crypto market.
Bloomberg reported on June 22nd that the Bloomberg Galaxy Crypto Index is “stuck in a negative trend” after experiencing a rejection at 400. The Index is a basket of BTC and top altcoins, such as Ethereum, Litecoin, and XRP, created by Bloomberg and Galaxy Digital.
Bloomberg came to this conclusion by evaluating the “DVAN Buying and Selling Pressure Indicator,” which suggests BTC remains in a bear trend.
On-chain analyst Cole Garner also identified three reasons why Bitcoin’s “next big move is likely down.” They are as follows:
- Blockchain analytics firm has registered massive transfer of BTC from miner-owned addresses to exchanges. This suggests miners will soon liquidate their coins as they see more downside in the future.
- As per CME futures data, institutional traders are still net short on Bitcoin. This group of investors has called bearish price action in the past by increasing their shorts.
- Bitfinex’s order book data suggests there’s been decreased buying and increased selling, supportive of a price decline. Specifically, the “delta” of the order book has purportedly been skewed negative, something last seen prior to declines over the past few months.
1/ I am massively bullish on #Bitcoin, but I think the next big move is likely down.@glassnode just reported the largest $BTC transfer from miners to exchanges in over a year. pic.twitter.com/Uwj4hHveyx
— Cole Garner (@ColeGarnerBTC) June 24, 2020
Featured Image from Shutterstock
Price tags: xbtusd, btcusd, btcusdt
Charts from TradingView.com
This Textbook Distribution Analyst Says Bitcoin Could Dive Under $7,000