- DigiByte increased by 35% following its listing on Binance
- The price is still trapped in a triangle pattern despite the latest surge
- The bullish sentiment remains valid across trading pairs
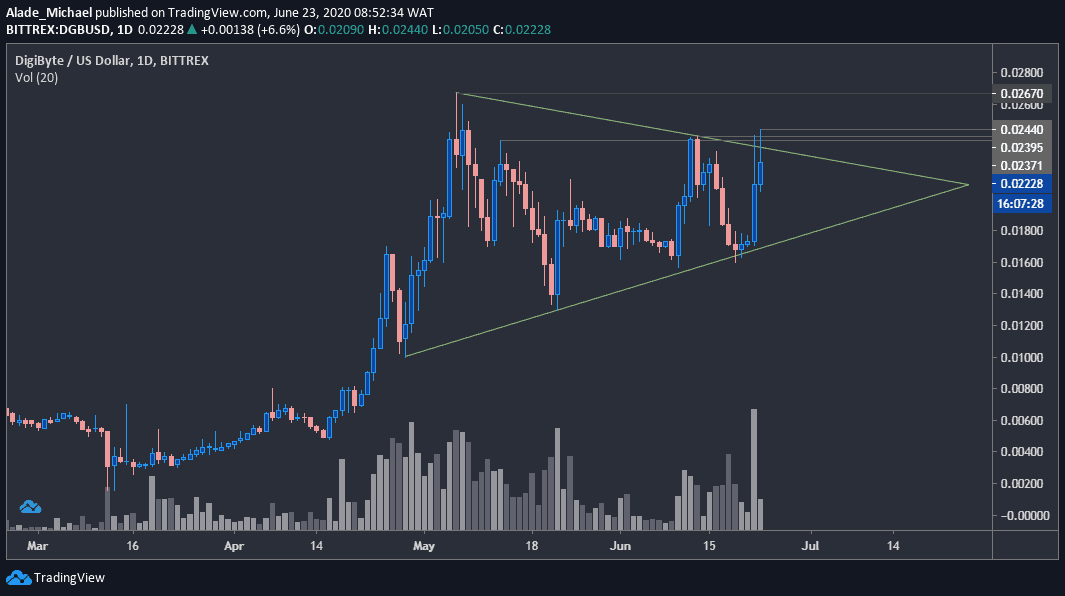
DGB/USD: Digibyte Remains Trapped In a Triangle
Key Resistance Levels: $0.0244, $0.0267, $0.030
Key Support Levels: 0.0205, $0.016, $0.013
Following yesterday’s listing on the leading cryptocurrency exchange, Binance, the price of DigiByte increased by almost 35% to reach $0.0244, but it dropped a bit to where it’s currently trading around $0.0222. Still, the price is up by 23.4%.
Apart from the fundamental aspect of this surge, DGB is technically forming a triangle pattern on the daily chart to indicate a continuation of the past months’ bullish actions.
It’s also important to pay attention to rejections over the last 48-hours around the triangle’s resistance at $0.024, which suggests a potential drop in price.
DGB Price Analysis
The price is currently trading near the triangle’s resistance after failing to break away twice. There are many challenges above, but if the buyers can clear today’s high at $0.0244, the next price target would be last month’s high of $0.0267. A new resistance may come around $0.030 if a break occurs.
If DGB continues to get rejected around the triangle’s upper boundary, the price may look for a rebound at $0.0205, which is around the triangle’s lower edge. Support to watch below this price level is $0.016, from where the growth started last weekend. The following support is $0.013 and $0.01.
Considering the latest price increase, a new bullish cycle may start soon if the buying volume continues to increase by the day.
DGB/BTC: The Price Faced 255 SAT Resistance
Key Resistance Levels: 261 SAT, 274 SAT, 294 SAT
Key Support Levels: 202 SAT, 178 SAT, 167 SAT
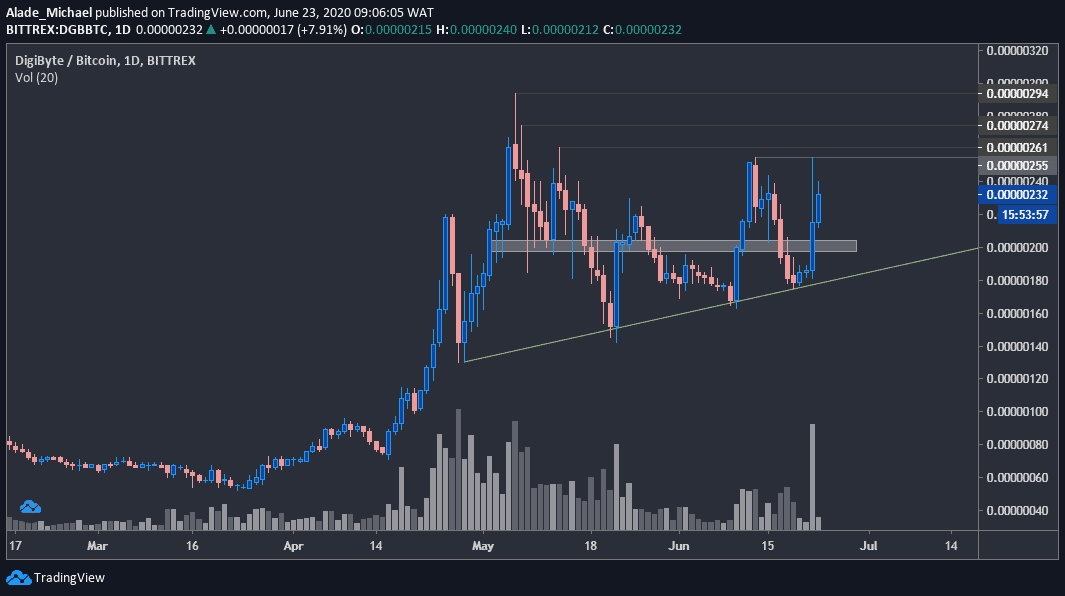
Against Bitcoin, DigiByte’s price increased by 25% after it was listed at 201 SAT yesterday on Binance. But as of now, it is changing hands around the 232 SAT level. The 35th largest cryptocurrency by market cap is technically gaining momentum, but exhaustion may set in if the 255 SAT resistance level continues to suppress bullish actions.
Although, there’s a grey-marked buy zone at 202 SAT in case of a drop. But if the buyers keep showing commitment and manage to conquer the above resistance level, strong buy actions can be expected in no time.
As can be seen on the daily chart, the green ascending trend line is still acting as diagonal support for the short-term bulls. A steep drop beneath this trend line can trigger a massive sell action in no time. The 20.33% increase over the past hours is enough to say that buyers are gaining control over the current daily chart.
DGB Price Analysis
A push above the 255 SAT level should see buyers through to 261 SAT and 274 SAT levels. The primary price targets for the bull lies at the 294 SAT resistance level, where the correction started in early May.
As mentioned above, there’s still hope for the bulls at 202 SAT support near the rising trend line. Right below this support lies the 178 SAT level, followed by 167 SAT. The price may even reach 130 SAT if the pressure remains strong.