- Polkadot price analysis is bearish today.
- Support for DOT is present at $16.
- Resistance is present at $18.
The Polkadot price analysis shows that the bears have succeeded in continuing their lead, as their progression has entered the fifth day. A considerable amount of loss in DOT value has been observed as the price has decreased up to $16.6 because of the continuous downslide. DOT has revisited this lower price envelope after the month of July 2021. A steep plunge in the price level was observed yesterday as the past few days proved extremely detrimental for the overall coin value, and today the situation is the same because of the decreasing trend. The next support for DOT is present at $16.
DOT/USD 1-day price chart: Trading volume goes down by 10 percent
The 1-day Polkadot price analysis is showing signs of a downward trend as more selling activity has been indicated by the red candlestick. The pressure from the sellers’ side is high, which is helping the bears to maintain their lead, and the price has been effectively decreased to $16.6, losing another 3.8 percent overnight. The trend was upwards during the previous week, but this week proved quite damaging for the buyers. As the price is going down, so is the trading volume, which has decreased by 10.23 percent.
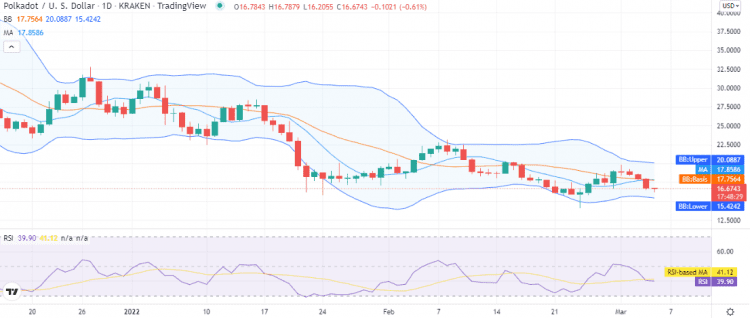
The volatility is mild as the Bollinger bands are maintaining the distance, price action is more inclined towards the lower limit of the indicator. The Upper Bollinger band value is present at $20, representing resistance, whereas the Lower Bollinger band value is present at $15.4 representing support for DOT price. The Relative Strength Index (RSI) score is now touching 39 after the continuous decrease in price.
Polkadot price analysis: Latest developments and further technical indications
The 4-hour Polkadot price analysis confirms that the cryptocurrency price decreased considerably at the start of the trading session as the bulls have been leading the market. But despite the selling pressure, the coin just got support, and the price has started to recover, as a green candlestick has appeared during the last four hours, and the price has recovered to $16.6, which is a hopeful sign.
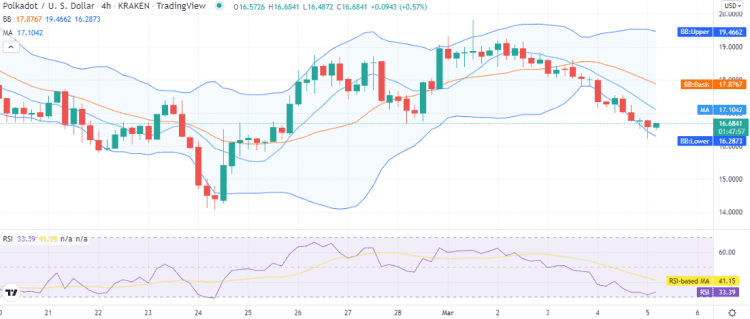
The volatility is high for DOT/USD, with the upper limit of the volatility indicator at $19.4, representing a resistance zone for DOT price, and the lower limit is at $16.2, representing the support. The moving average value in the four 4-hour price chart is trading at $17.1 above the price level, but the SMA 20 continues to trade below the SMA 50 curve due to the bearish market. The RSI also took an upturn as the buying activity resumed and had come up to index 33, which is a neutral value but quite lower.
Polkadot price analysis conclusion
The Polkadot price analysis suggests the price function is still under bearish pressure. The bullish gains are comparatively smaller for the day. The momentum that bears showed at the start of the trading session shows that bears might take over the market again in the coming hours. It can be expected that DOT may continue upside today if the support at $16 persists, or otherwise, the DOT/USD may step down into the $15 range.
Disclaimer. The information provided is not trading advice. Cryptopolitan.com holds no liability for any investments made based on the information provided on this page. We strongly recommend independent research and/or consultation with a qualified professional before making any investment decisions.