- Chainlink broke down from a channel after reaching $4.9 during a three-month rally.
- Against Bitcoin, it started to form a symmetrical triangle pattern after recording a yearly high at 56739 SAT in March.
- LINK regained momentum with an 8% surge overnight.
LINK/USD: Chainlink Dropped Off Short-Term Channel
Key Resistance Levels: $4.25, $4.5, $5
Key Support Levels: $3.5, $3, $2.8
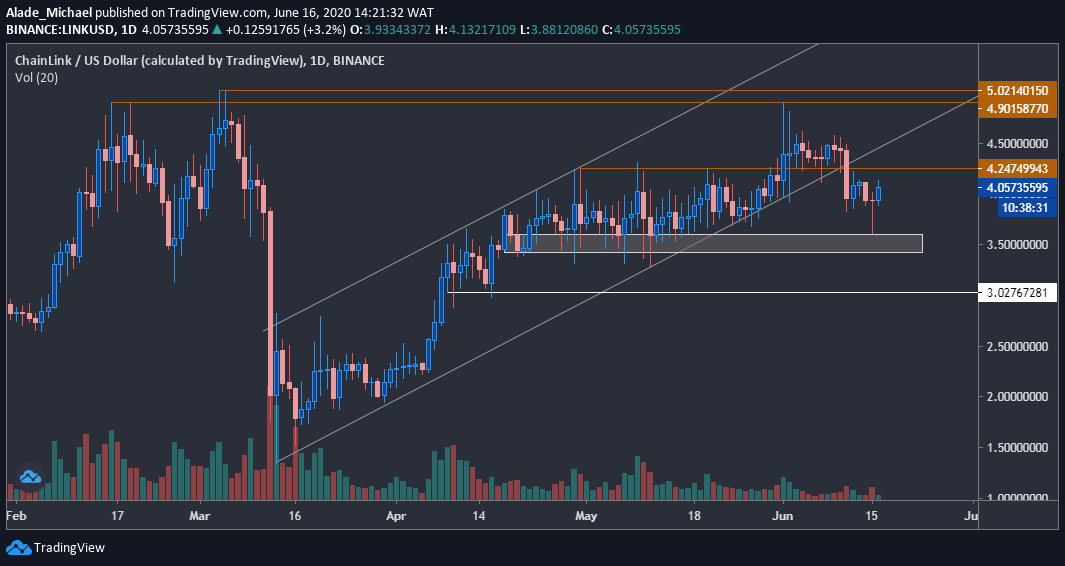
Following Bitcoin’s crash to $8900 yesterday, Chainlink’s price dropped by almost 5% to a daily low of $3.6. This low is around a crucial demand zone holding for the past two months. Although, the price has bounced back with 8% gains overnight.
It is now trading slightly above $4 against the US Dollar. However, the massive breakdown from a three-month channel on June 11th suggests a strong bearish correction.
The latest bounce is just a retest, which is likely to end around the $4.25 resistance. From here, Link is most likely to initiate a fresh drop, which could last to $3 or even beyond in the coming days. But if buyers reclaim this resistance, more gains can be expected.
Chainlink Price Analysis
Considering the recent channel breakdown on the daily chart, Chainlink’s price could see more losses in the future. While anticipating this move, it might encounter a strong demand zone at $3.5.
Support below this zone lies at $3 – marked white – in case of a breakdown. The price may wick at $2.8 if the supply gets heavy.
As mentioned above, the price is recovering towards $4.25 on the upside. A push above this price could allow buying actions to $4.5. Reaching the $4.9 – $5 resistance area would be a key breakout level to watch for a long-term increase.
LINK/BTC: Chainlink Plotting Big Move Inside a Symmetrical Triangle
Key Resistance Levels: 45000 SAT, 47000 SAT, 52500 SAT
Key Support Levels: 40500 SAT, 37566 SAT, 33100 SAT
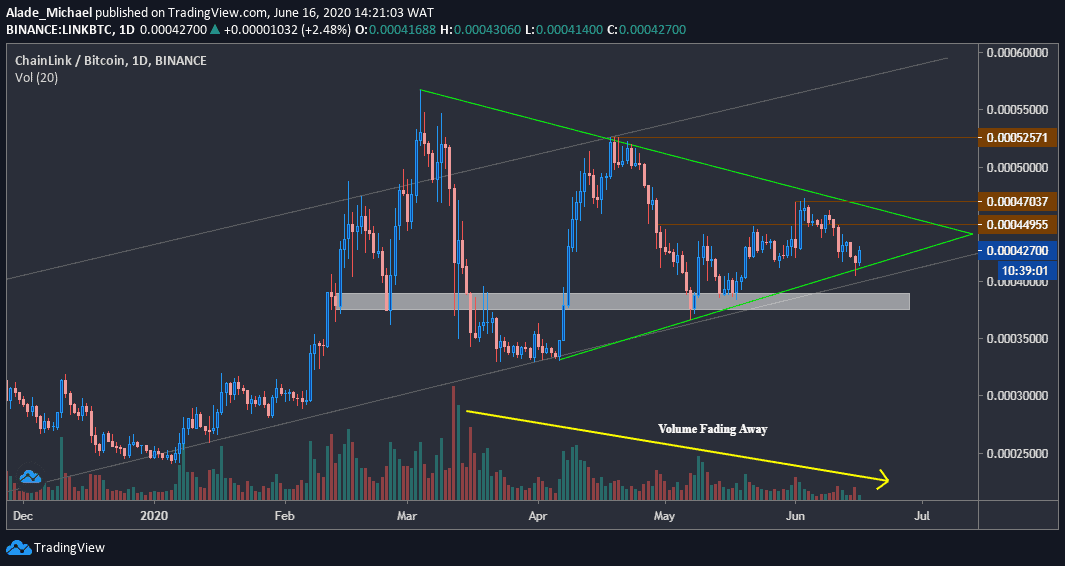
Since March, Chainlink’s volume has continued to decrease on the daily chart following series of highs and lows to form a symmetrical triangle inside a 9-month ascending channel.
Yesterday, Chainlink found support around the triangle’s support, and it sharply bounced back to where it’s currently trading around 42800 SAT. The price is now rising towards 45000 SAT with a bullish engulfing candle. Analyzing this pair with the Elliott Triangle Wave (ABCDE) shows that the price could break up with the current rebound move.
LINK Price Analysis
Considering a triangle break up at around 45000 SAT, an immediate resistance to keep in mind is 47000 SAT, from where the price started to fall earlier this month. The next resistance can be found at the 52500 SAT level.
Chainlink recently found support around the triangle’s bottom at the 40500 SAT level. If this support breaks, right below the 9-month channel, there’s a considerable demand zone at 37566 SAT. A break down from here would trigger a strong sell, although it would have to face the March-April low of 33100 SAT level before it starts to drop further.