- XRP continues to trade sideways with a small 0.6% price drop this week.
- Ripple has been trapped within a descending triangle for the last five weeks.
- Against Bitcoin, XRP struggles to hold the 2070 SAT support as the sellers start to push to fresh multi-year lows.
Key Support & Resistance Levels
XRP/USD:
Support: $0.2, $0.192, $0.18.
Resistance: $0.215, $0.22, $0.225.
XRP/BTC:
Support: 2050 SAT, 2020, 2200 SAT.
Resistance: 2100 SAT, 2200 SAT, 2300 SAT.
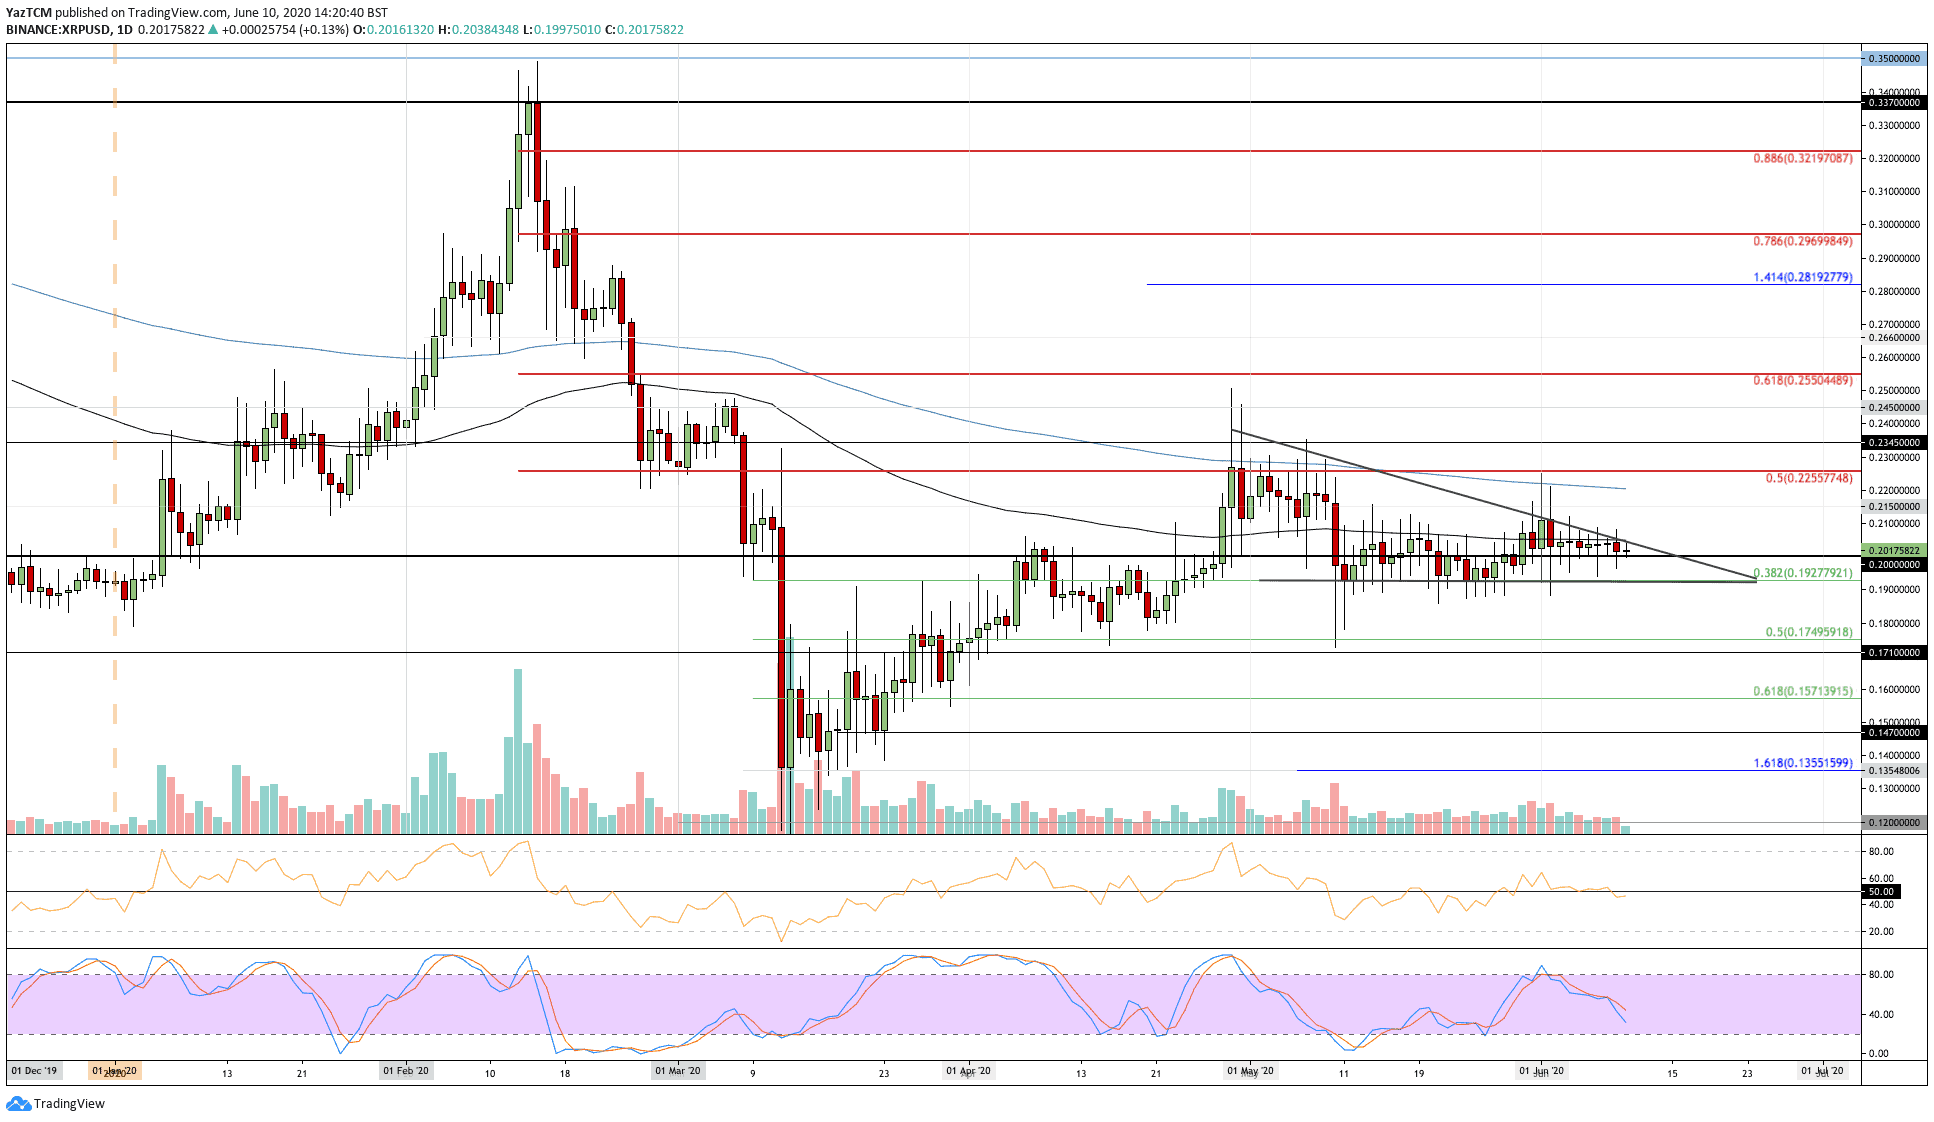
XRP/USD – XRP Trading Continues Within Triangle.
XRP has been trapped within a descending triangle for the past five weeks of trading. The coin is approaching the apex where a breakout is expected in either direction. However, it does seem that it might be going down.
It is also struggling to pass the 100-days EMA in June as it prevents the coin from pushing higher. A push beneath $0.192 would likely start the unwind toward $0.16 for XRP.
XRP-USD Short Term Price Prediction
If the sellers push XRP beneath the $0.2 level, the first level of strong support lies at $0.192 (.382 Fib Retracement), which is also the base of the current consolidation pattern. Beneath this, support is found at $0.18, $0.175 (.5 Fib Retracement), $0.171, and $0.16.
On the other hand, if the buyers push higher and break the resistance at the 100-days EMA and the falling trend line, the first level of resistance is located at $0.215. Above this, resistance lies at $0.22 (200-days EMA), $0.225 (bearish .5 Fib Retracement), and $0.234.
The RSI has dipped beneath the 50 line to indicate that the sellers are starting to take control of the market momentum. For a positive breakout, the RSI must break above 50 to show that the buyers are controlling the momentum within the market.
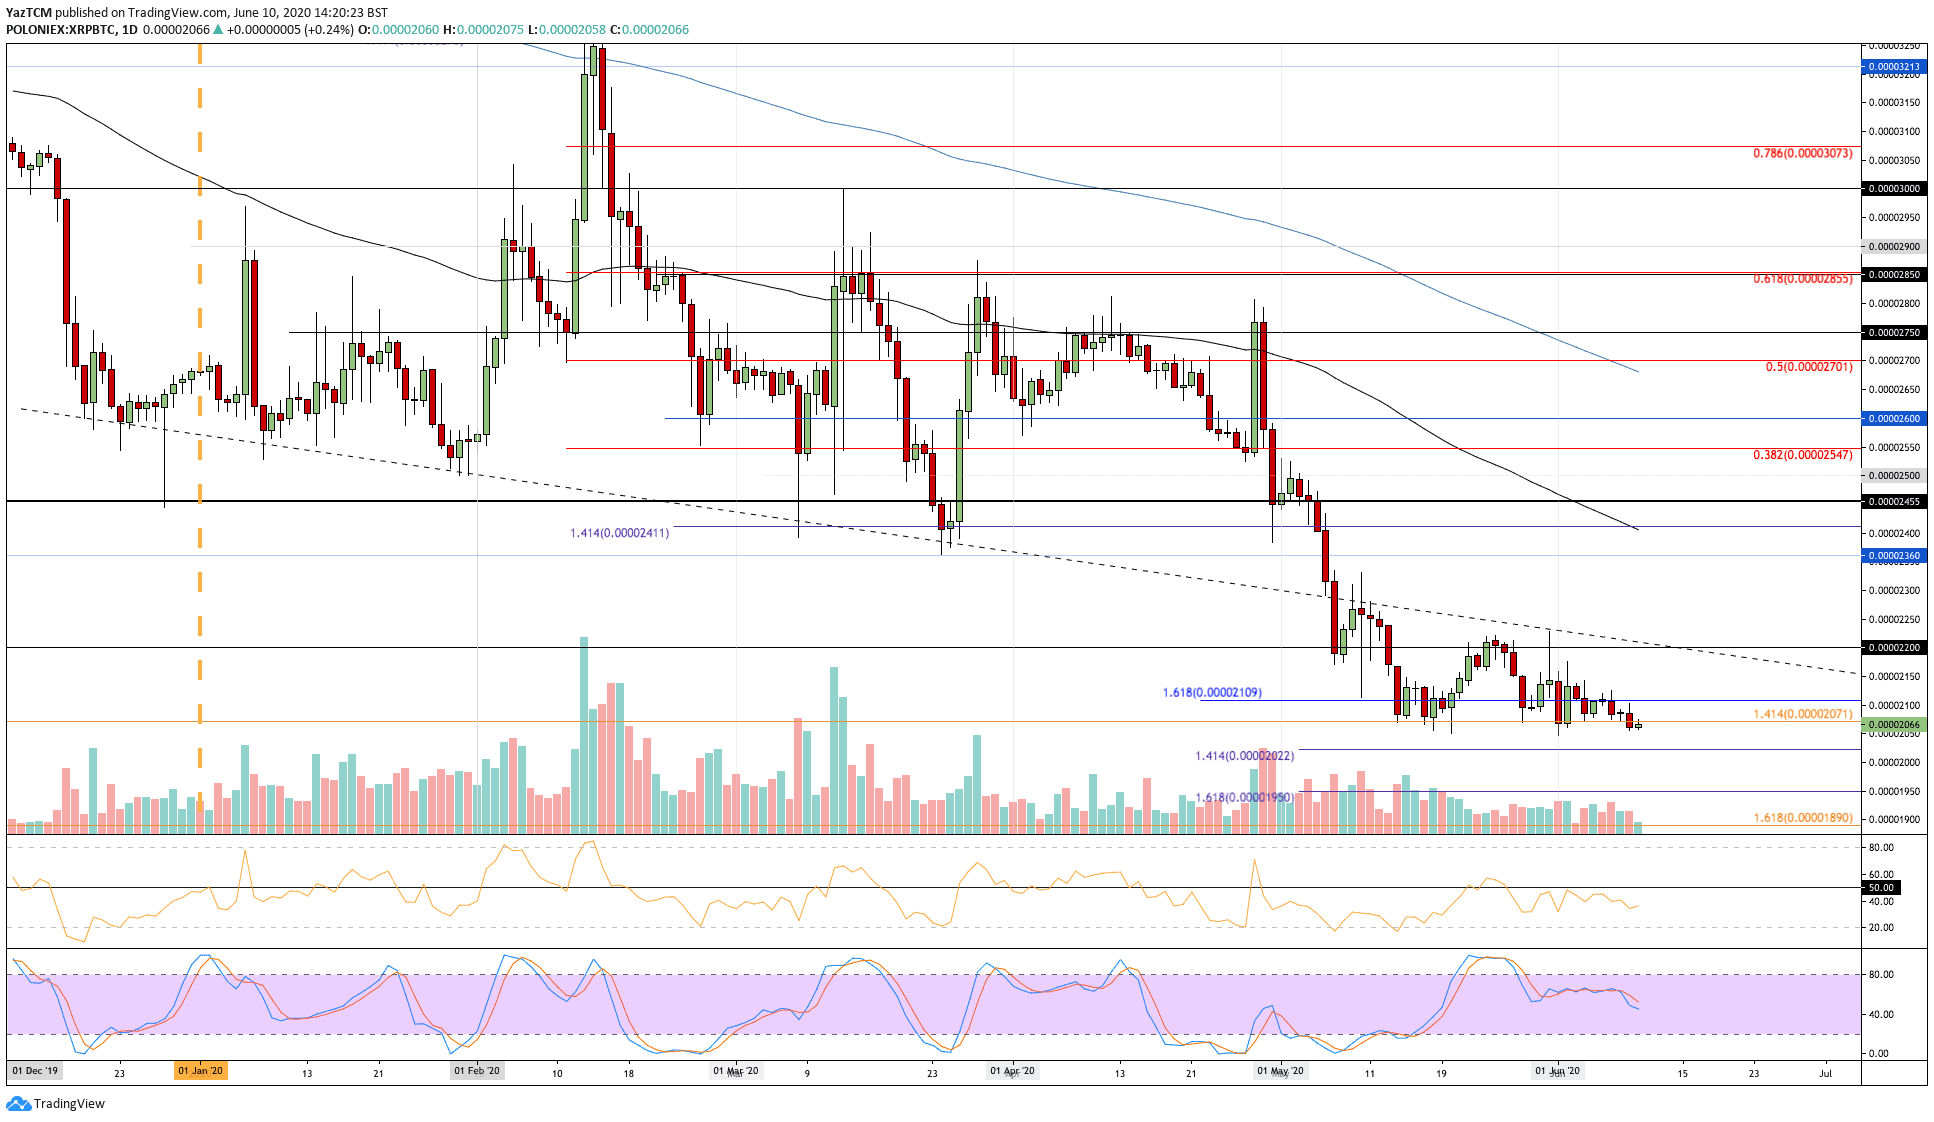
XRP/BTC – XRP Set To Create Fresh Multi-Year Lows?
XRP woes continue against BTC as it breaks beneath the 2070 SAT support and trades at 2066 SAT. 2070 SAT is a multi-year support line that has held the market for over two years. The break beneath this support could be a potential indication that XRP is about to start a fresh leg lower against Bitcoin, which would see it headed toward 1000 SAT again.
XRP-BTC Short Term Price Prediction
If the sellers do push XRP lower, the first level of support is found at 2050 SAT. Beneath this, support is located at 2022 SAT, 2000 SAT, 1950 SAT, and 1890 SAT.
Alternatively, if the buyers push higher, the first level of resistance is expected at 2100 SAT. Above this, resistance lies at 2200 SAT, 2300 SAT, and 2360 SAT.
The RSI is well beneath the 50 line to show that the sellers dominate the market momentum. If the RSI drops further, XRP can be expected to head back toward 2000 SAT.