- Cardano exhausted buying pressure after marking a new yearly high near $0.092.
- It maintained the same trend across trading pairs as sellers slowly take over in the short-term.
- The price is currently down by 4%.
ADA/USD: Cardano Eyeing $0.070 For Short-Term Correction
Key Resistance Levels: $0.085, $0.088, $0.0917
Key Support Levels: $0.074, $0.0688, $0.0631
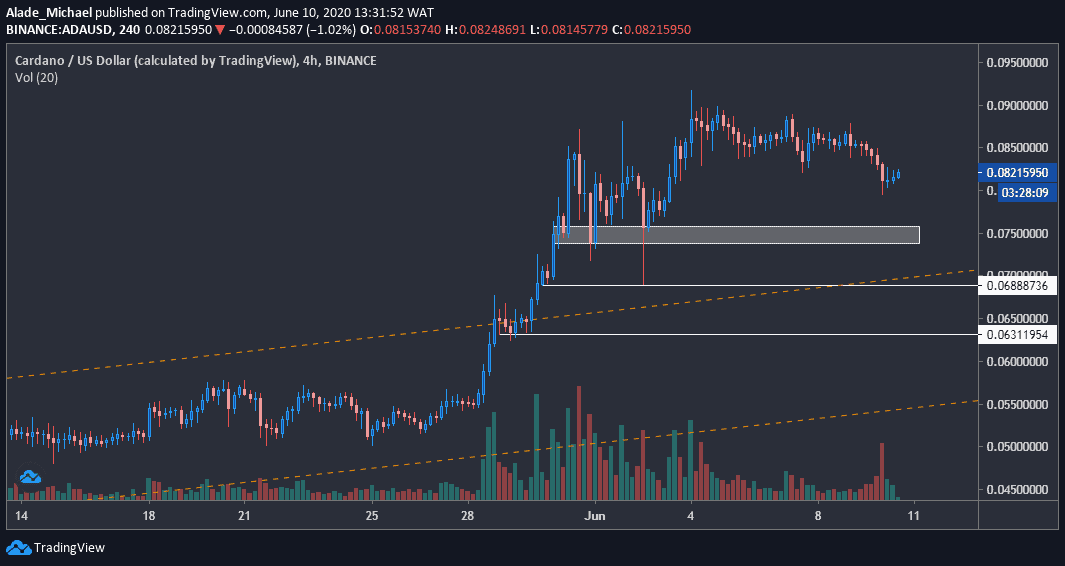
The recent 30% increase in Cardano’s price seemed to have exhausted buyers after hitting $0.0917 on June 4. The price action is still looking bullish on a mid-term, but it is currently down by 4.12%. ADA now trades around $0.0814.
As of now, Cardano is seemingly changing its trend as sellers slowly gain control on the 4-hour chart.
This suggests that more big moves might be underway, although the volatility is quite low at the moment. But technically, more sell action could play out once the price drops below the grey demand area of $0.074. Another factor to consider is that the volume on the chart is extremely low.
Cardano Price Analysis
The bearish pressure is likely to reach the grey demand zone of $0.074. Below this lies $0.0688 support in case the price plunges further. Subsequent support is located at $0.0631, inside the channel pattern that got broken on May 29.
If Cardano can find solid support on the channel, around $0.070 level, a rebound can be anticipated on a mid-term perspective. Nonetheless, it is currently holding major resistance at $0.088 and $0.0917 – the new yearly high. But the key level to watch for now is $0.085.
ADA/BTC: Cardano Exhausted Buying Pressure
Key Resistance Levels: 900 SAT, 947SAT
Key Support Levels: 777 SAT, 704 SAT
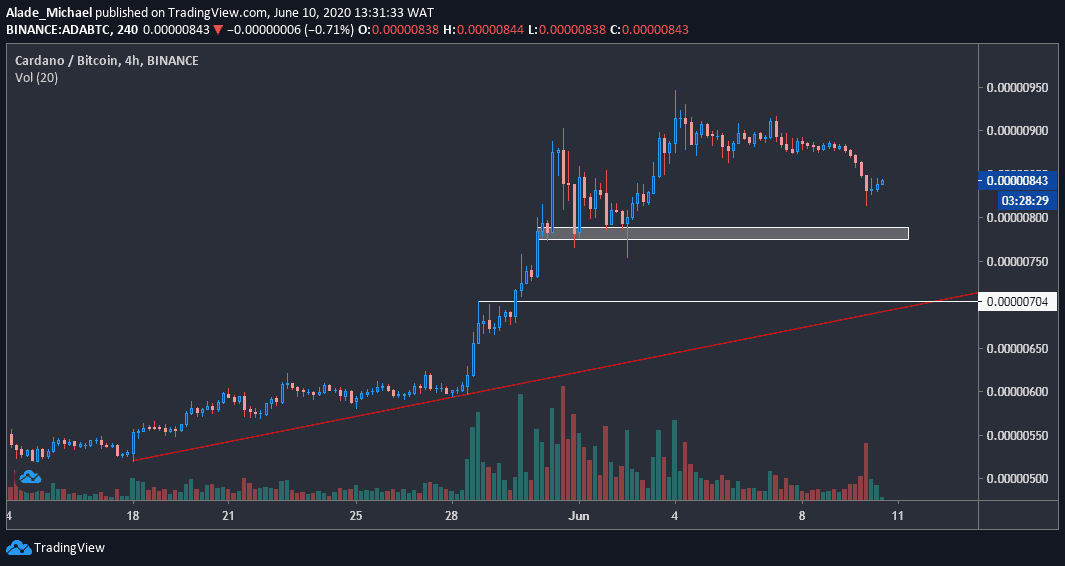
Against Bitcoin, Cardano’s price is similarly losing momentum for a while now but the mid-term bullish trend is still looking very valid. The exhaustion at 947 SAT level has induced a significant 18% drop in the price over the past few days.
It currently trades at 839 SAT following a slight recovery from 815 SAT (daily low). The recovery is likely to reach 900 SAT.
Considering Bitcoin’s indecisiveness for some days now, there’s still hope for the bulls as soon as the primary cryptocurrency regains momentum. But if BTC fails to show strength, Cardano’s short-term correction might last longer than expected until it finds a bottom.
Cardano Price Analysis
While Bitcoin remains calm, selling pressure should be expected at the mentioned demand area – 777 SAT. If a breakdown occurs, there’s a key rebound level at 704 SAT, which corresponds with the red diagonal line on the chart.
A drop below that line could cause a serious decrease in price on a short-term perspective.
If the last bounce from 815 SAT happens to hold for longer, the price could climb back to the 900 SAT resistance as mentioned earlier above. A further increase above this level could allow Cardano to reclaim the current yearly high of 947 SAT before creating a new one.