Over the past days, while the equity markets are breaking records, Bitcoin is lagging. The indecisive state of mind the cryptocurrency is going through continues into this week.
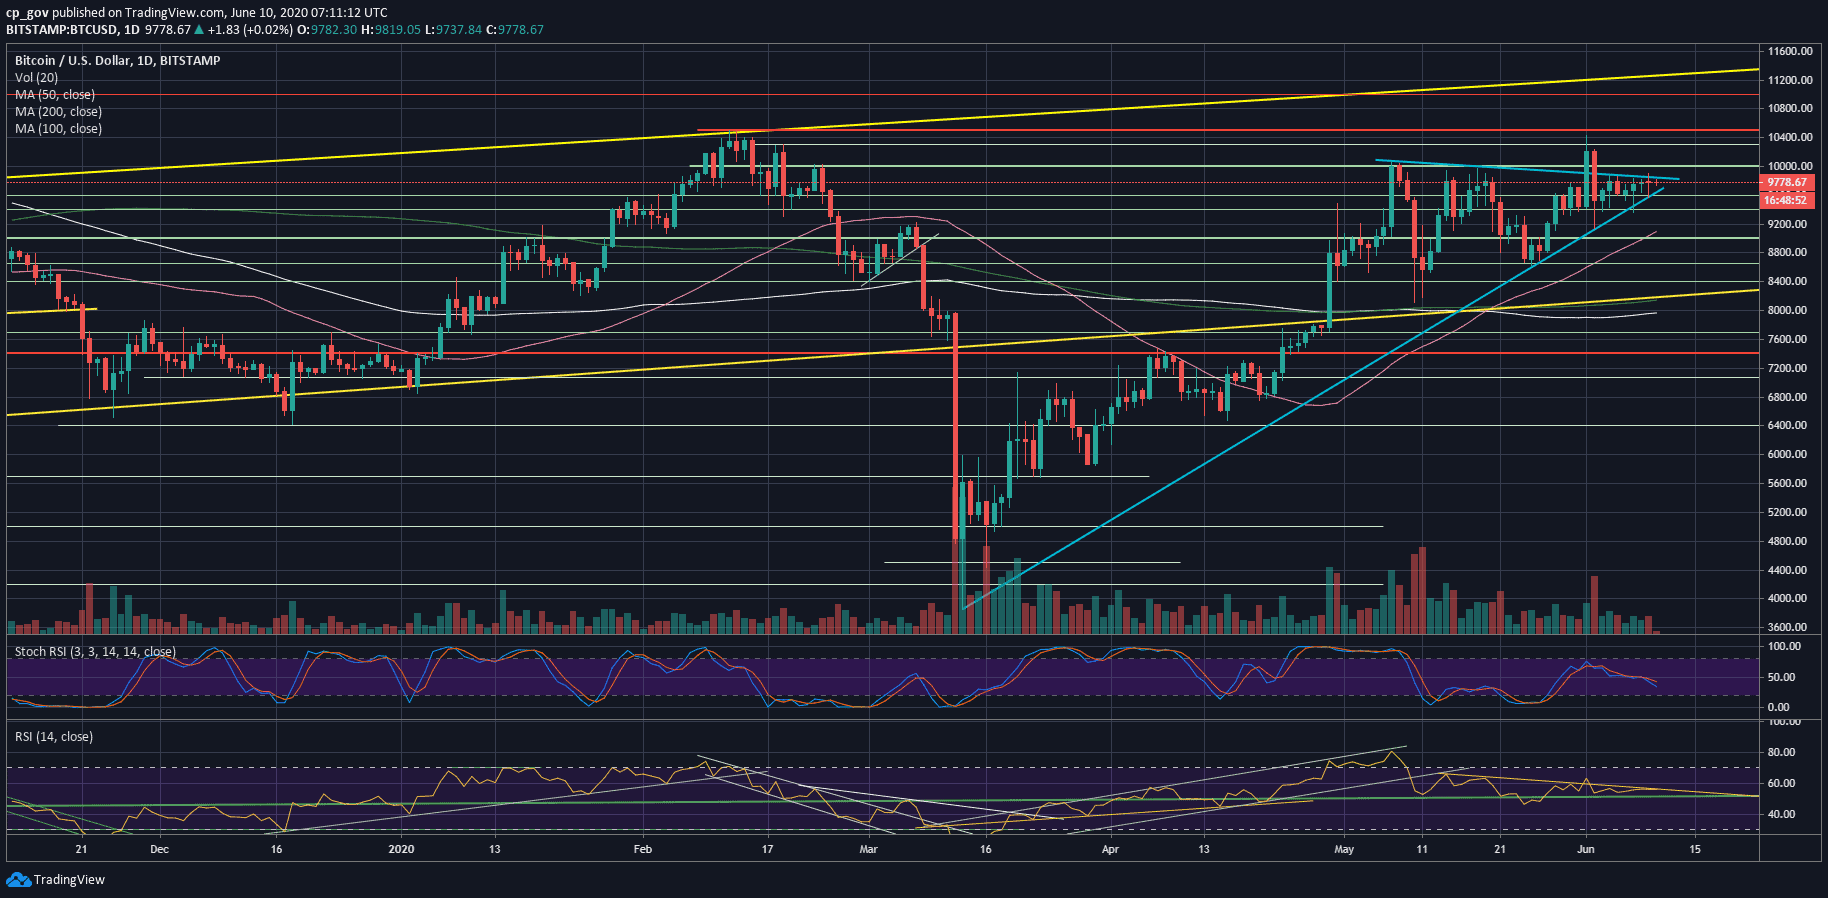
As can be seen in the following daily chart, the Bitcoin price is forming a symmetrical triangle (the two blue trend-lines), reaching the apex in 2-3 days approximately. During that timeframe, we expect a decision to be made, followed by a huge price move.
Decision – Soon?
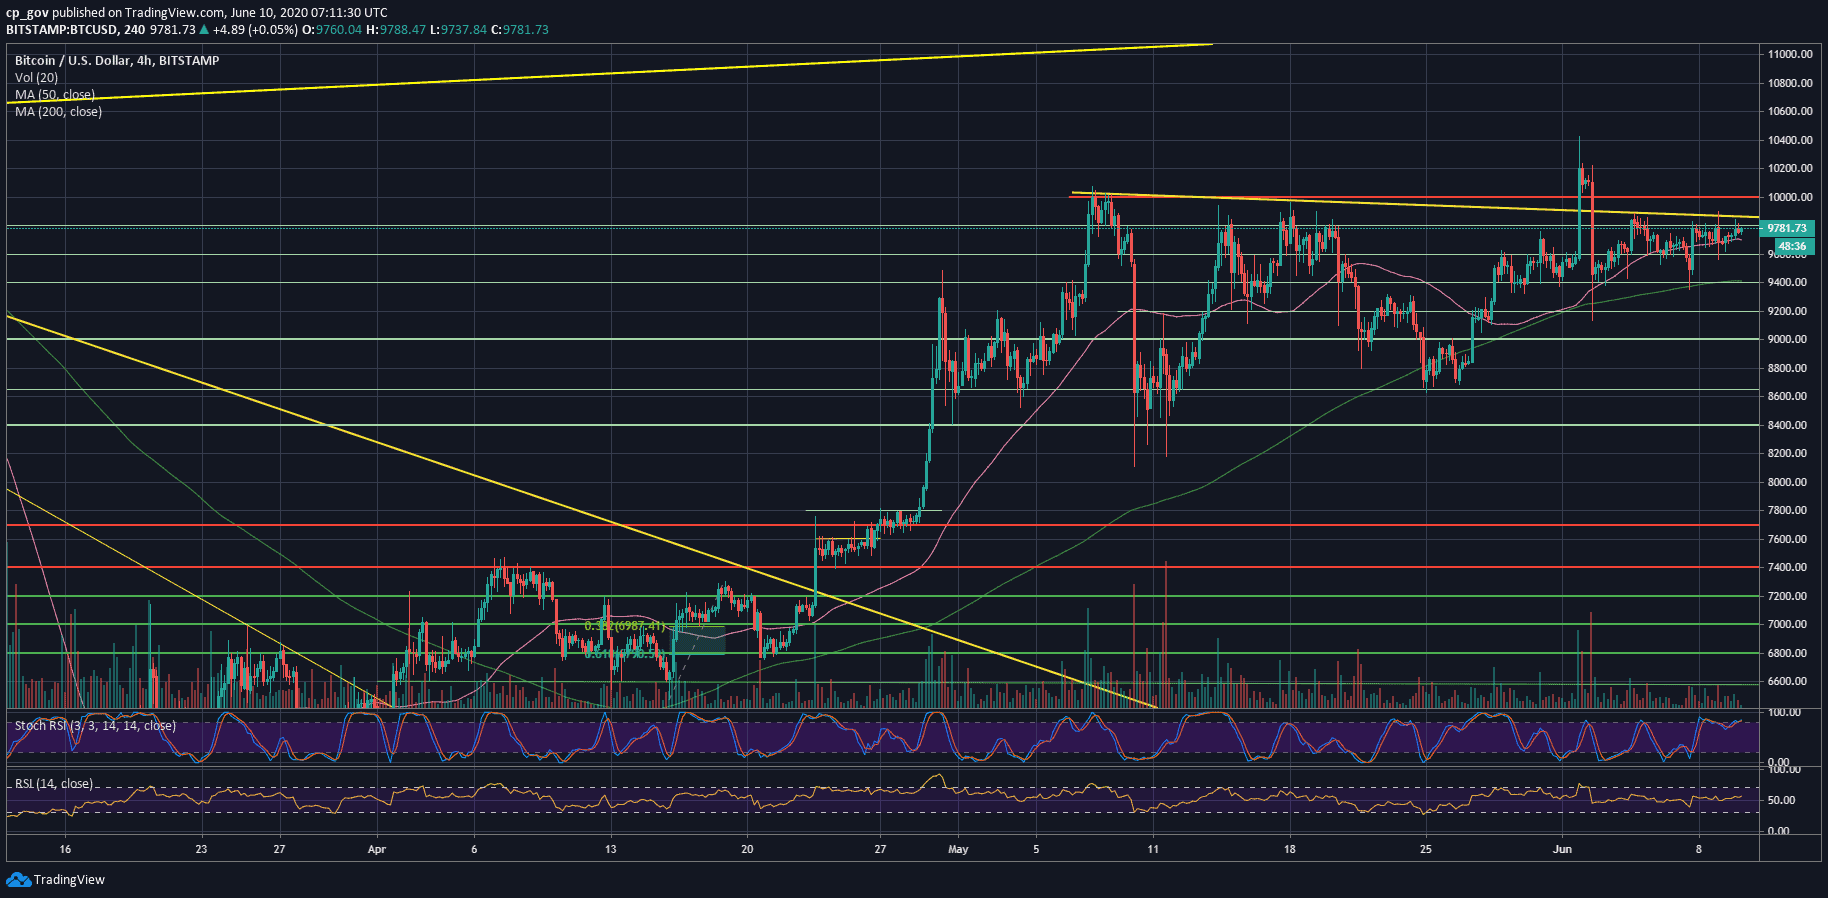
If we look at the micro-level, or the following 4-hour chart, we can see that Bitcoin is mostly trading between the price range of $9600 – $9800. There is a serious battle between the buyers and the sellers – every time the price exits from the range, it doesn’t take long for it to get back, leaving a candle wick.
While Nasdaq recorded a new all-time high above the legendary number of 10,000 just hours ago, Bitcoin is ‘stuck’ under the same price mark.
Over the past months, we were used to see a positive correlation between the two assets – Bitcoin and the equity markets – however, this correlation faded away recently.
Key Support and Resistance Levels
As mentioned above, the price of Bitcoin is concentrated between $9600 and $9800. A real breakout, and we are likely to see the next direction for BTC.
From above, the range between $9800 to $10,000 is also full of sellers’ demand. Hence, if Bitcoin makes it and breaks above the psychological $10,000 and holds it (daily close), we can be careful to state, but this should ignite a mini bull-run.
Above $10K, the first level of resistance lies around $10,200, while the significant level is the $10,500 – the 2020 high (reached twice – mid-February and a week ago).
From below, the first level of support beyond $9600 is the familiar $9400. This is followed by $9100 – $9200, which includes the 50-days moving average line (marked pink).
From the technical point of view, the RSI indicator is also ‘stuck,’ just a little above the crucial 50 benchmark level. Aside from the RSI, the trading volume is dull over the past days. The declining volume levels also anticipate a move coming up in the next days.
Total Market Cap: $277.8 billion
Bitcoin Market Cap: $180 billion
BTC Dominance Index: 64.8%
*Data by CoinGecko
BTC/USD BitStamp 4-Hour Chart
BTC/USD BitStamp 1-Day Chart