Shiba Inu trades at $0.00000474 on June 9, bouncing from a multi-month low of $0.00000430 reached days after the five-month triangle on the daily chart finally broke. The only thing bulls can point to right now is a 60% burn spike that landed the same session the chart cracked.
$SHIB Daily Chart Breakdown: What the Pattern Is Telling Traders
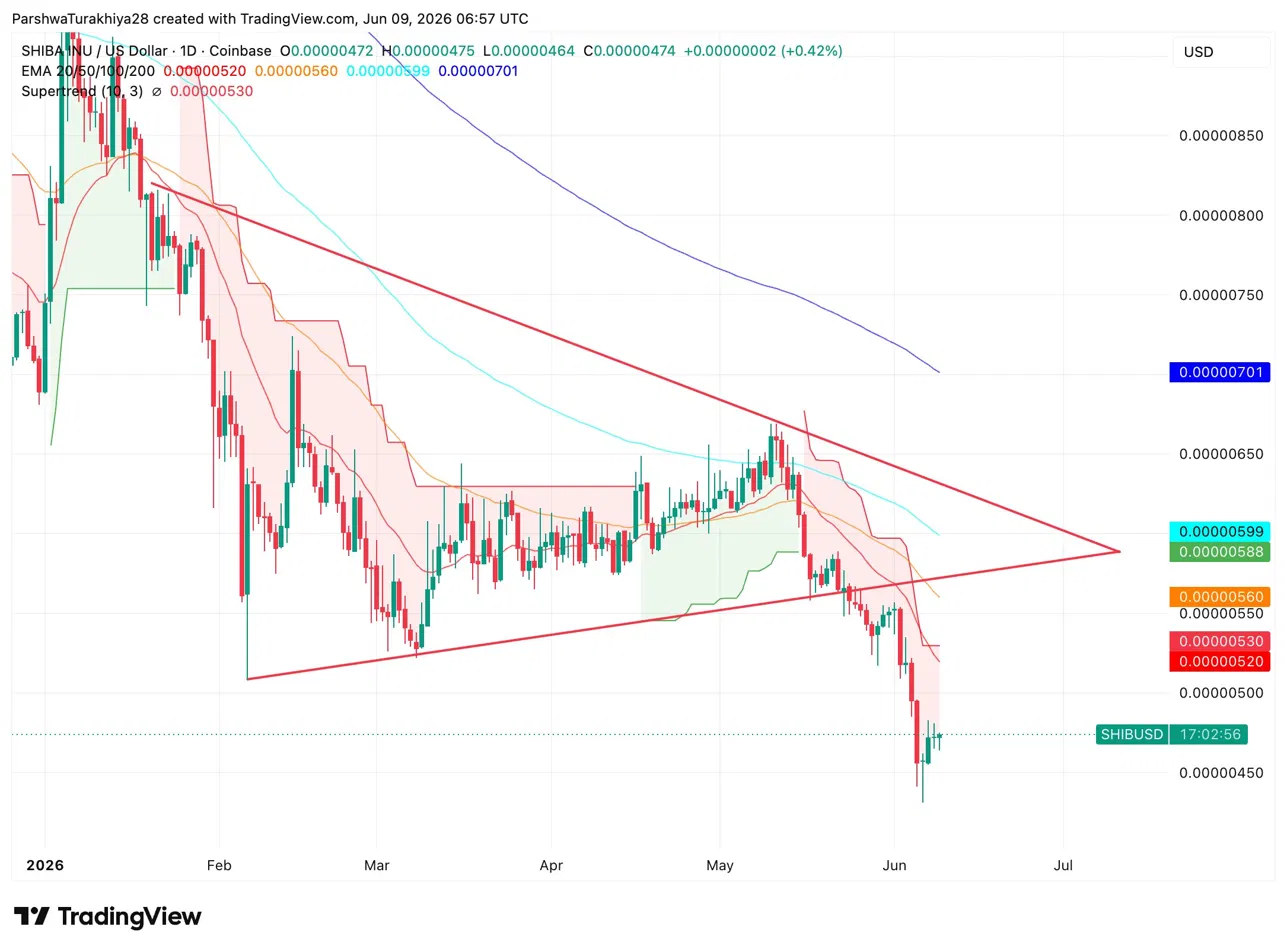
$SHIB spent the first half of 2026 coiling inside a descending triangle, printing lower highs from January’s $0.00000850 peak while holding a flat base near $0.00000480. That base broke in early June with back-to-back red candles rather than a wick flush, which gives the breakdown more technical credibility.
Related: Worldcoin (WLD) Price Prediction 2026, 2027, 2028, 2029, 2030-2050
All four EMAs sit above price in bearish order. The 200-day EMA at $0.00000701 is far overhead, and the Supertrend at $0.00000530 flipped red and now acts as first resistance.
- Resistance: $0.00000520 (20 EMA), $0.00000530 (Supertrend)
- Support: $0.00000440, $0.00000420 (triangle measured move target)
$SHIB Burn Rate Jumped 60% — Is Supply Pressure Actually Building?
The 24-hour burn chart shows tokens destroyed climbing from roughly 500,000 to over 1.1 million between 15:00 and 20:00 UTC on June 8, a 60% acceleration in under five hours. Bulls will flag this as a supply-side catalyst worth watching.
The 7-day chart pulls that argument back down. Burn activity peaked near 25 million tokens around June 3 before collapsing 71.07% through June 8. One spike day does not rebuild a burn trend, and without follow-through this week, the price impact stays limited.
$SHIB Derivatives Analysis: Long Liquidations Are the Story Right Now
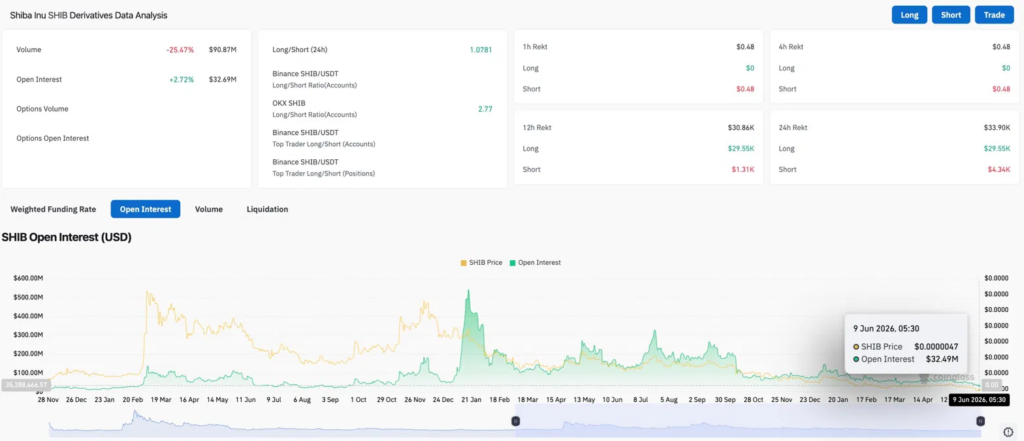
Volume dropped 25.47% to $90.87M while open interest climbed 2.72% to $32.69M. New positions are being added quietly while trading activity slows, pointing to cautious positioning rather than directional conviction. The Binance long/short ratio sits at 1.0781, nearly neutral, while OKX leans more bullish at 2.77.
Over the past 24 hours, $29.55K in long positions were liquidated versus just $4.34K on the short side. Longs are absorbing the pain in this move.
$SHIB Hourly RSI Signals the Bounce May Be Running Out of Gas
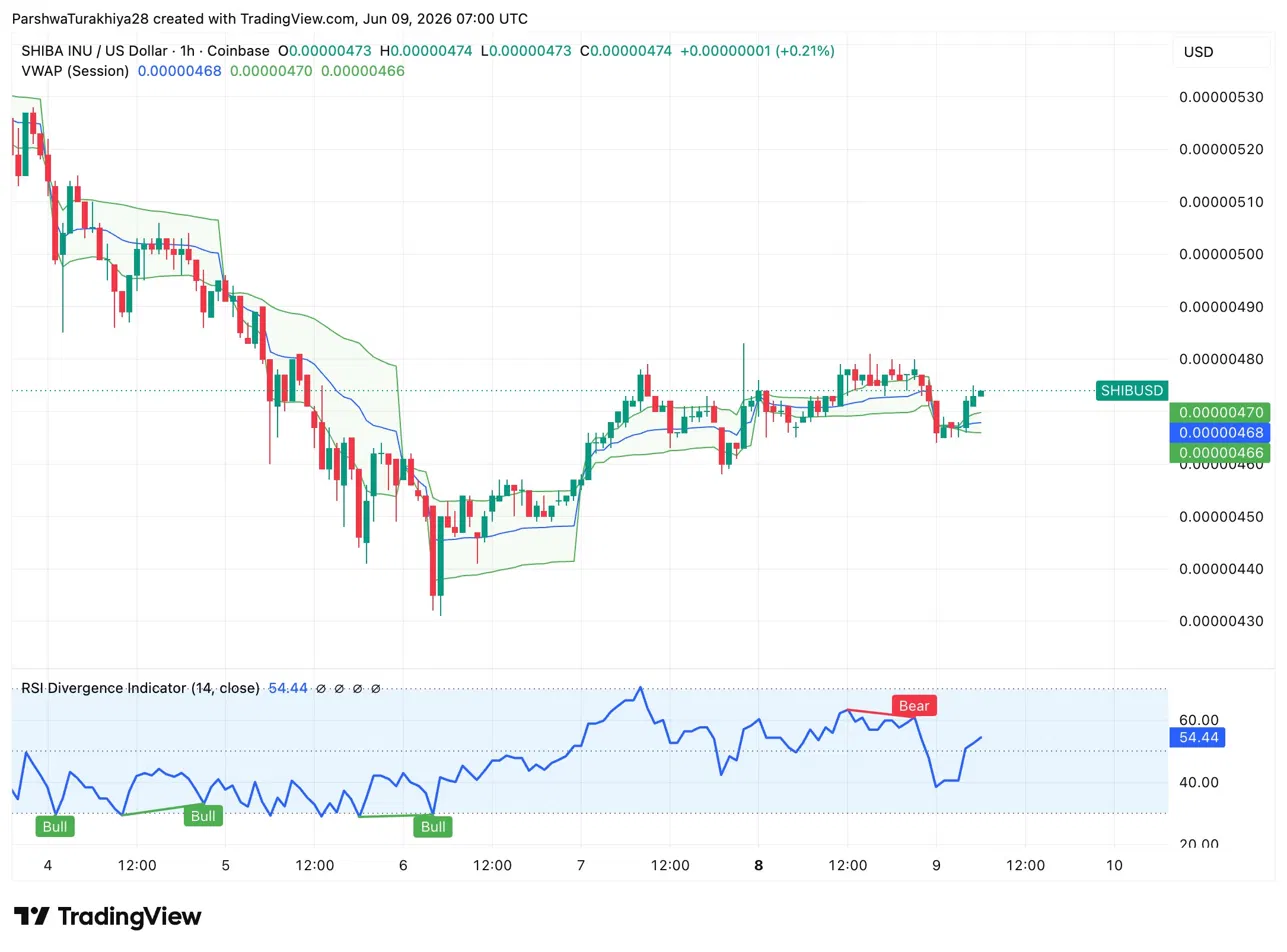
Price recovered from $0.00000430 and now holds above all three VWAP bands stacked between $0.00000466 and $0.00000470.
Three bullish RSI divergences between June 4 and June 6 powered the move up. RSI sits at 54.44 with a fresh bearish divergence printed near $0.00000480, which means the recovery is losing momentum right at a logical resistance area.
Shiba Inu Price Prediction for June 10, 2026
- Upside: A hold above $0.00000470 and a reclaim of $0.00000530 puts $0.00000560 in play. Sustained daily burn activity above 1M tokens adds weight to that scenario.
- Downside: A close below $0.00000460 reopens the path to $0.00000420, the triangle’s measured downside target.