Welcome to crypto, even in 2020: yesterday Bitcoin finally made a move and reached the highest price areas of mid-February near $10,500. Just hours after, and we are back down at the prices of the past days once again.
A classic pump and dump: Usually, you see those types of price manipulations in low-cap coins. However, from time to time, the primary cryptocurrency proves that a Bitcoin ETF just makes no-sense.
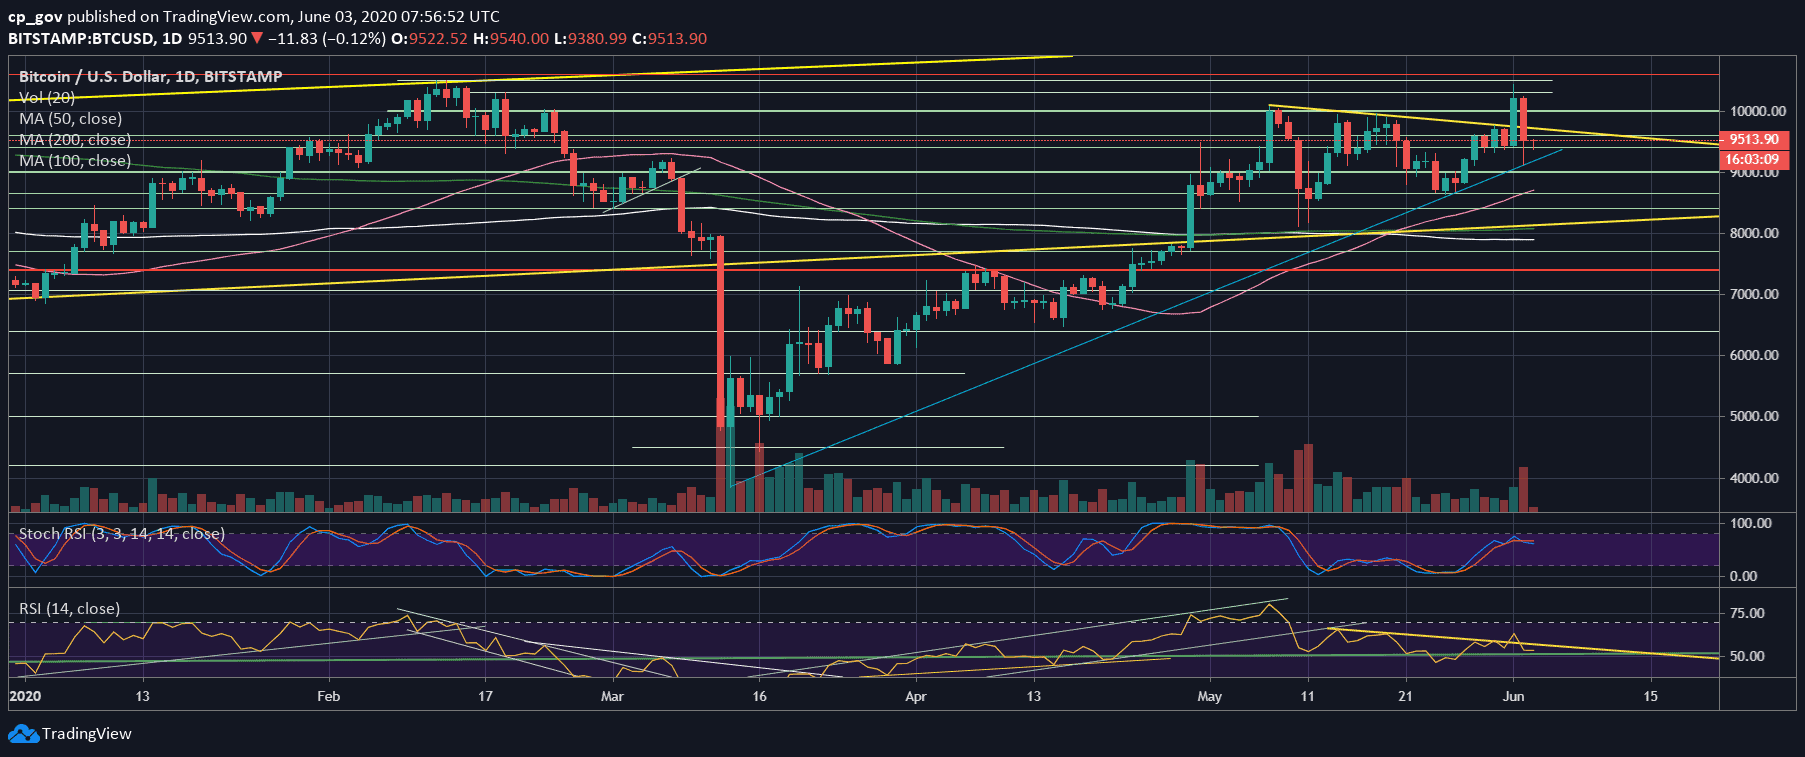
Yesterday’s drop reached even lower – to $8500 – on BitMEX exchange, while on the other major exchanges like Bitstamp, the low touched the blue mid-term ascending trend-line, as can be seen on the following daily chart.
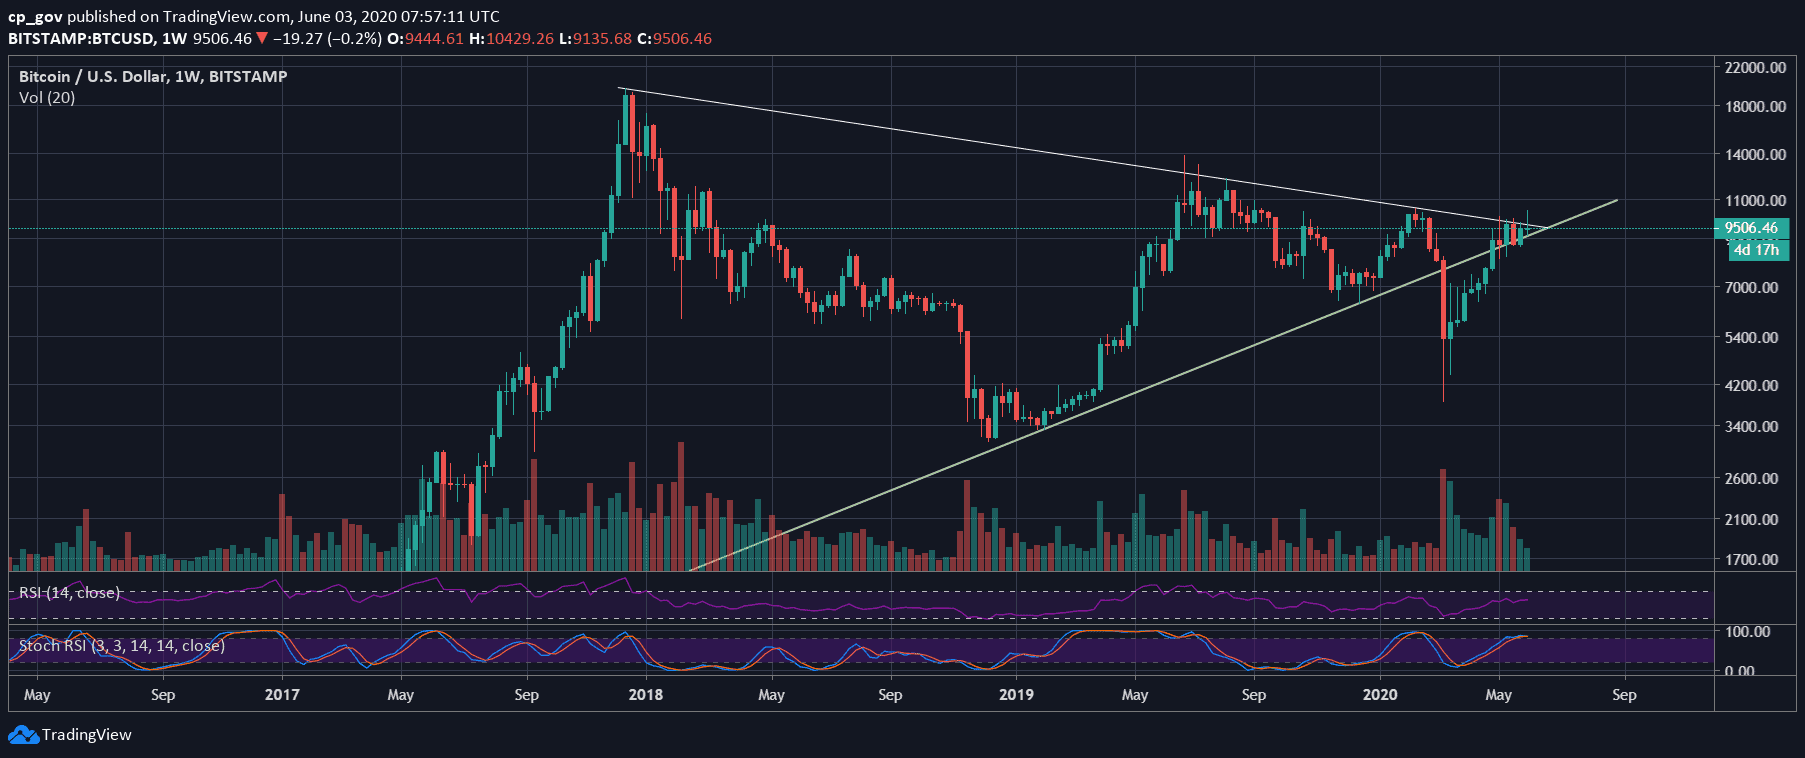
Besides, looking at the weekly chart, the lowest on Bistamp also touched the long-term ascending trend-line that started forming in January 2015.
It will be crucial for Bitcoin to close this weekly candle above yesterday’s low, around $9135. At the same time, a close above the upper descending trend-line at $9800 might turn into a bullish-sign.
Bitcoin failed to weekly-close above this descending trend-line ever since it started forming during December 2017 at the $20,000 all-time high.
The Immediate Effect
The $10,500 now becomes the ultimate nightmare of the Bulls. After they saw Bitcoin ‘mooning’ to new 5-digit highs, these celebrations quickly turned into complete uncertainty. Now, the mission seems even harder for the Bulls.
Besides, it also proves that price manipulations and false breakouts are still part of the crypto game. We need to consider them while trading.
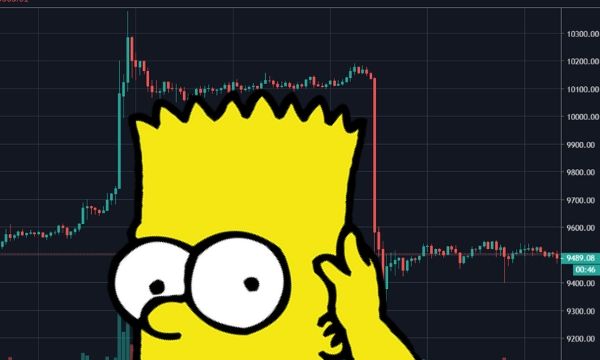
The better word to describe what we saw is “Bart,” named after Bart Simpson’s head:
Key Support and Resistance Levels for BTC
Bitcoin is back at the trading range of the days before the false breakout. The first level of support now lies around $9400, followed by $9150 – $9200 which was yesterday’s low. Further below lies $9000, $8800, and $8650.
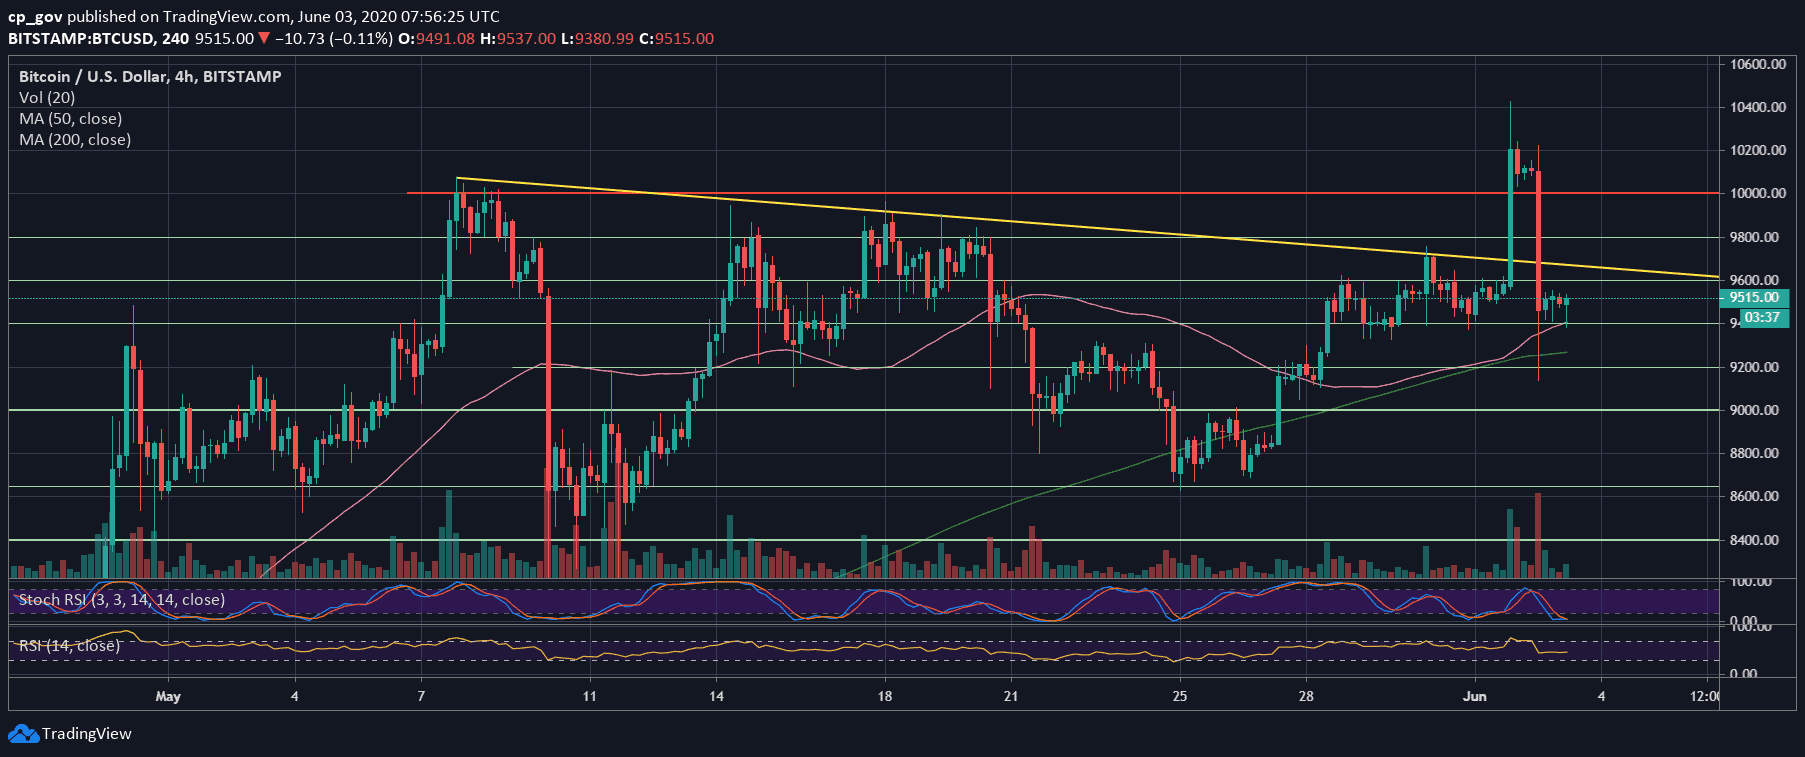
From above, the immediate resistance lies at $9600, along with the same descending trend-line as can be seen on both the following 4-hour and daily price charts.
The trend-line currently lies around $9700. Further above lies $9800, $10,000 and $10,200.
From a technical point of view, the RSI indicator of the daily maintained the critical level of 50, and the trading volume was huge: this was the highest daily candle since May 11, 2020.
Total Market Cap: $269.6 billion
Bitcoin Market Cap: $175 billion
BTC Dominance Index: 65.0%
*Data by CoinGecko
BTC/USD BitStamp 4-Hour Chart
BTC/USD BitStamp 1-Day Chart