Bitcoin Crashes Within Minutes
Bitcoin’s price is going wild. The flagship cryptocurrency was able to rise by more than 10% yesterday and move past the $10,000 threshold. However, BTC recently took a brutal $1,000 nosedive that erased these gains in a matter of five minutes.
Yesterday, Crypto Briefing warned readers that investors were growing overwhelmingly bullish about the recent price action. Sentiment sent the Crypto Fear and Greed Index into “greed,” which is a negative sign. But few predicted that the market would respond with a massive bearish impulse.
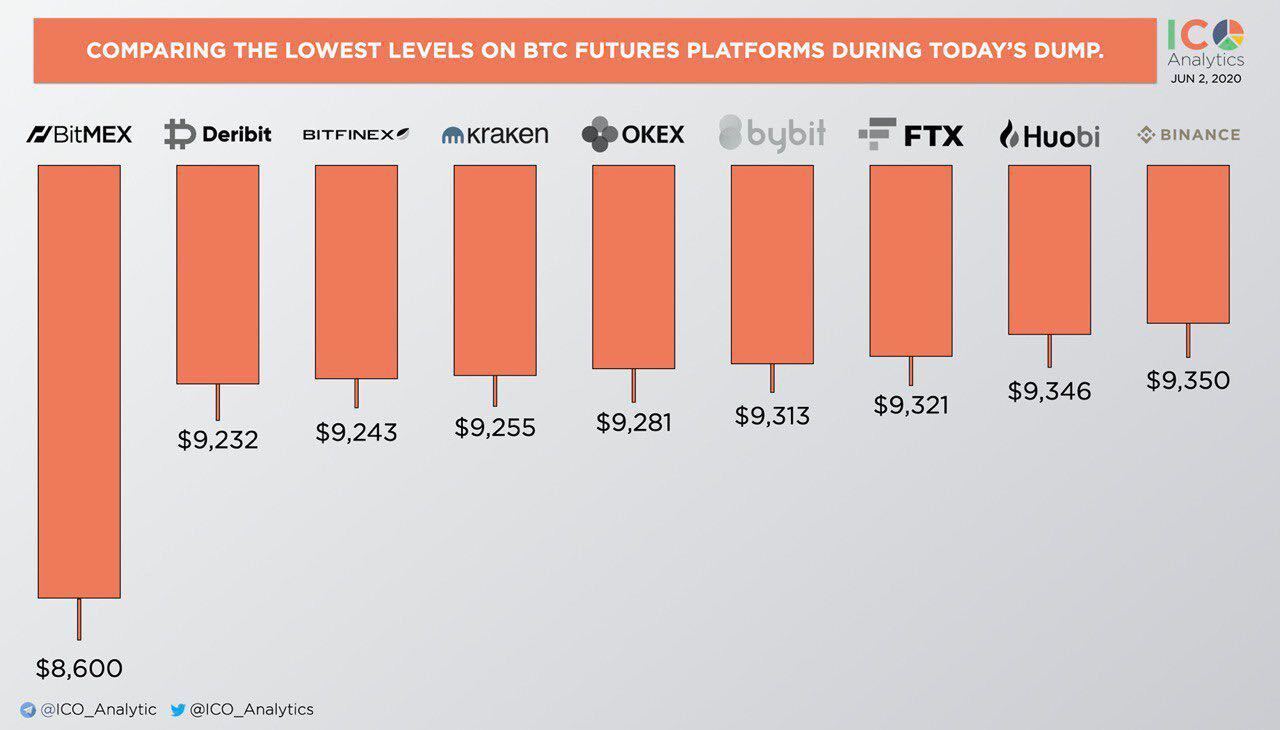
Nik Patel, the best-selling author of “An Altcoin Trader’s Handbook,” reported that across Coinbase, Bifinext, Bitstamp, Bybit, and FTX that BTC hit a low between $9,150 and $9,320. However, on BitMEX, over $102 million in long positions were liquidated, pushing BTC to $8,600.
Despite the sudden downward movement, different technical indexes show that everything is not lost yet.
There’s Still Hope for Recovery
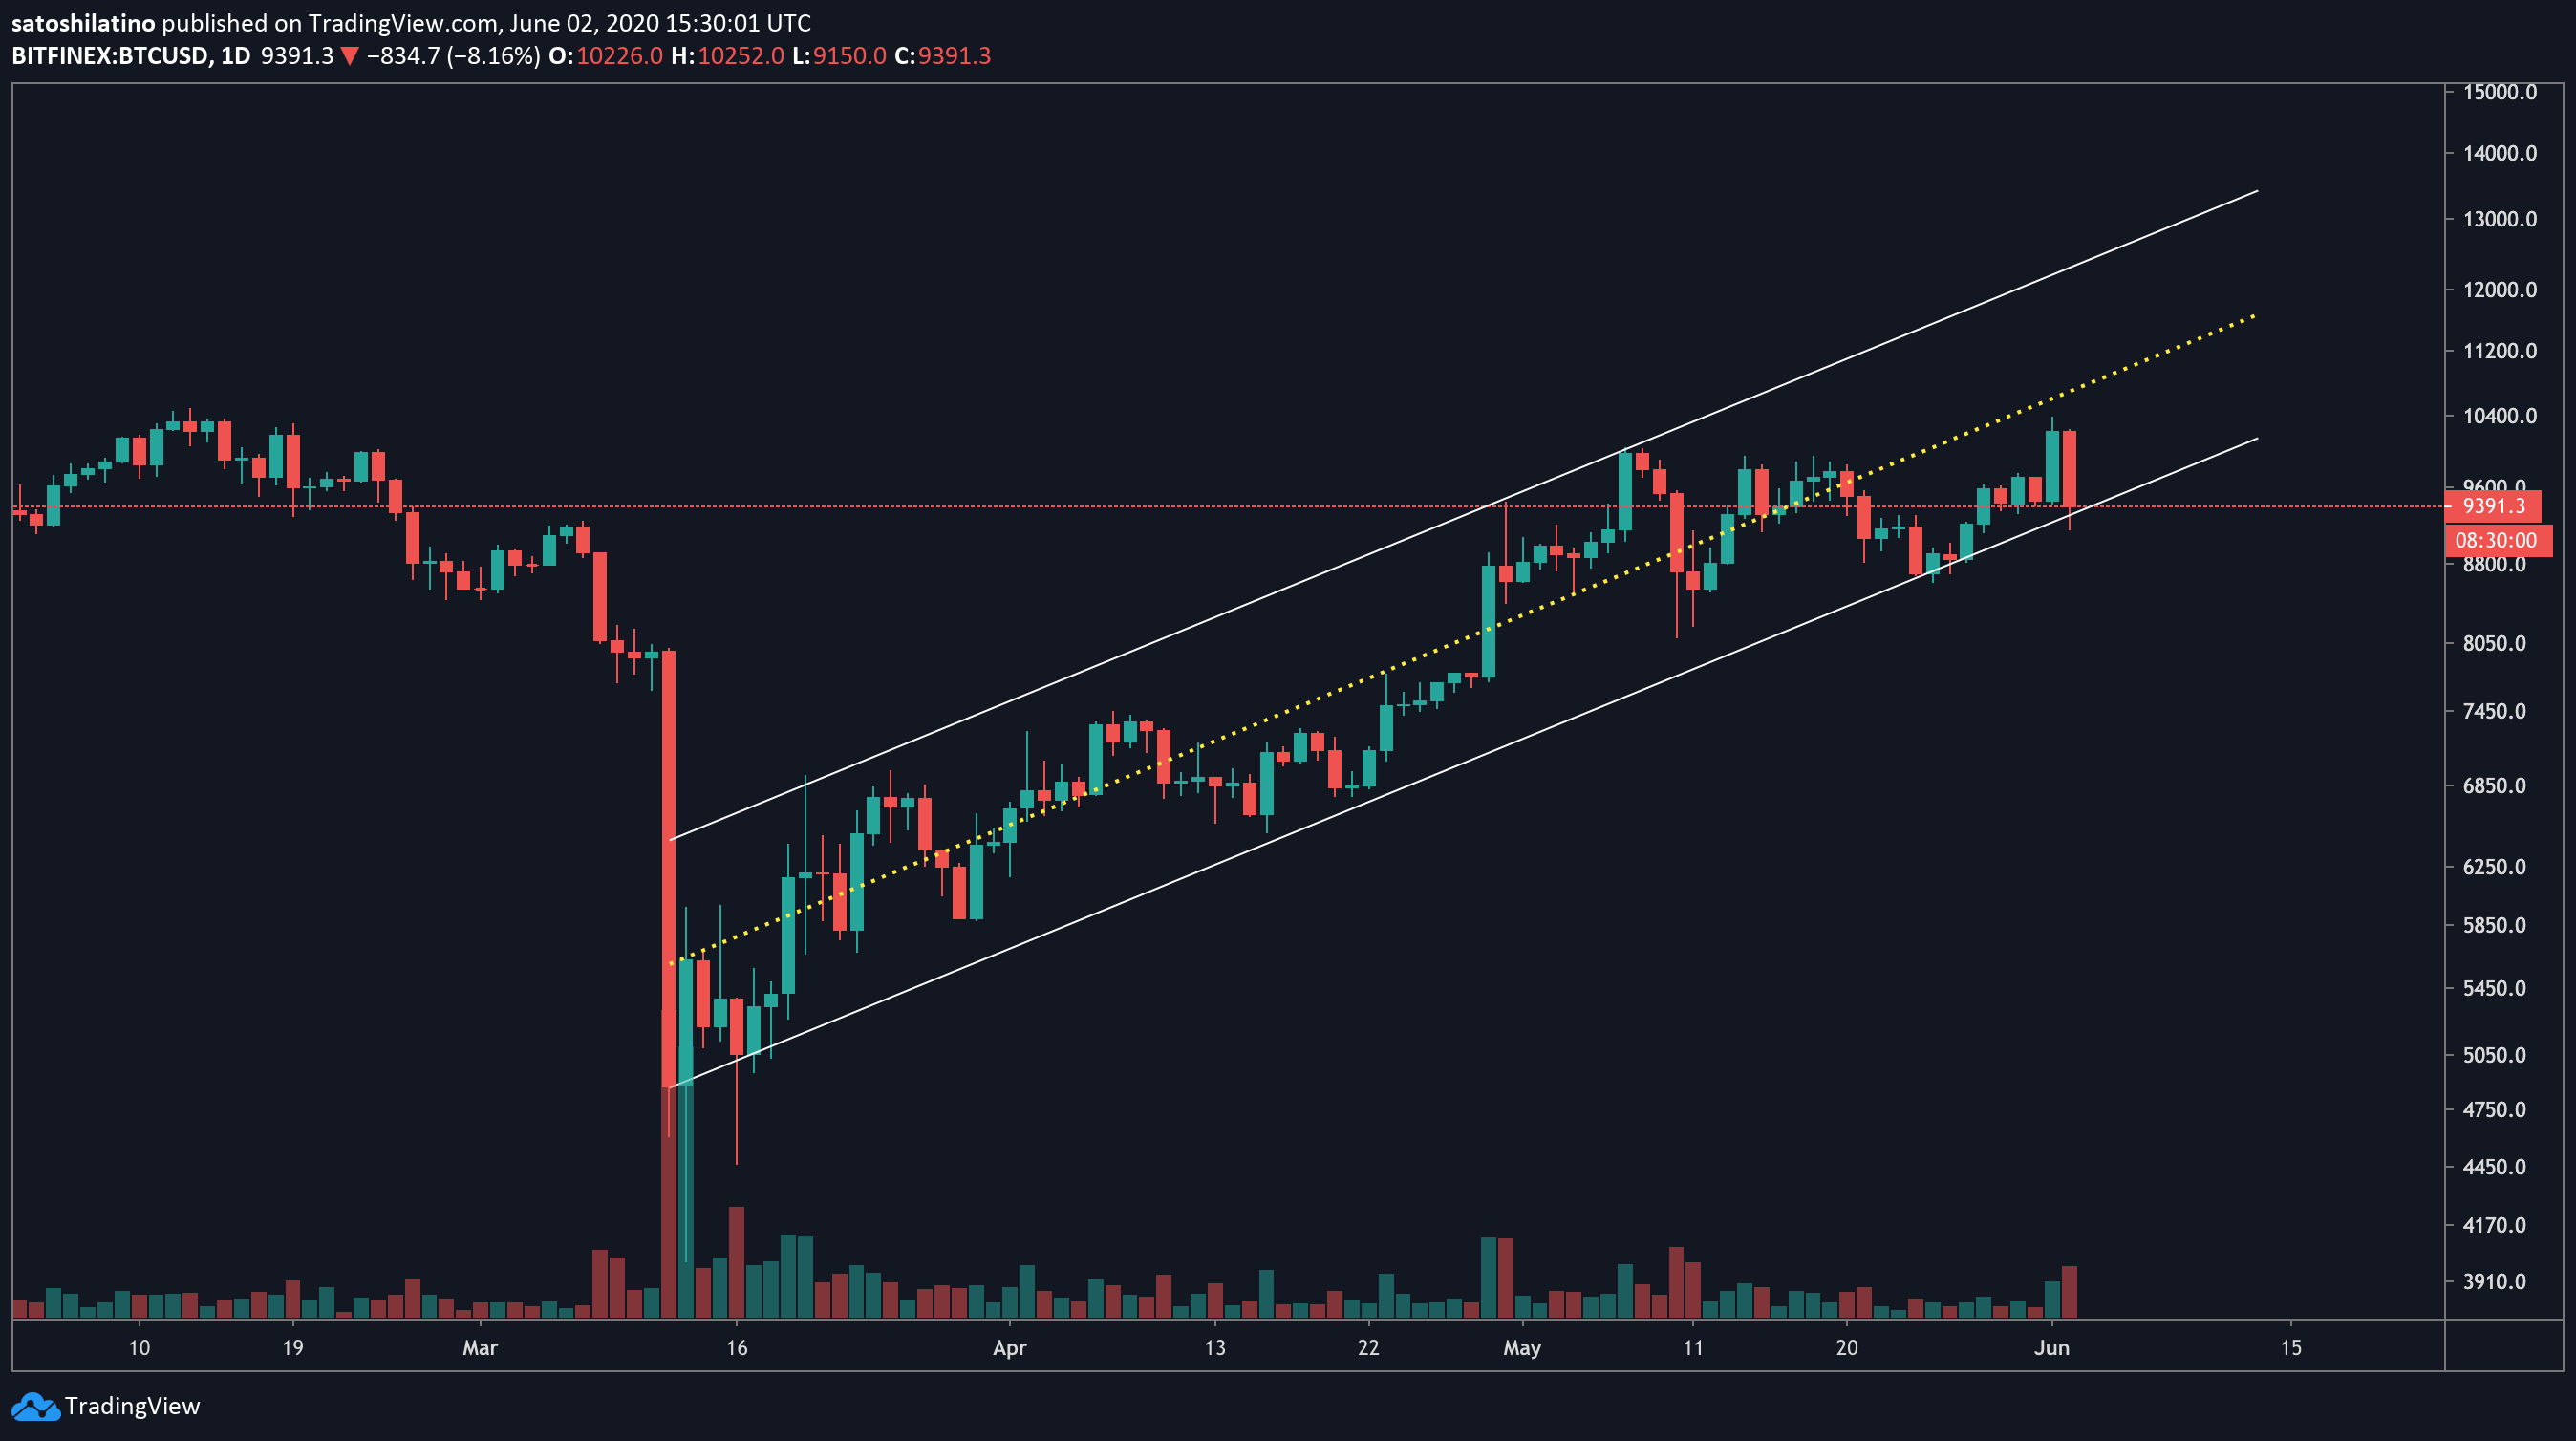
The lower boundary of an ascending parallel channel, which has contained Bitcoin since March’s Black Thursday, seems to have prevented a steeper decline.
If this barrier continues to hold, the price history of the past three months may repeat itself. The flagship cryptocurrency could then bounce off this support level back to the middle or towards the upper boundary of the channel at $12,500.
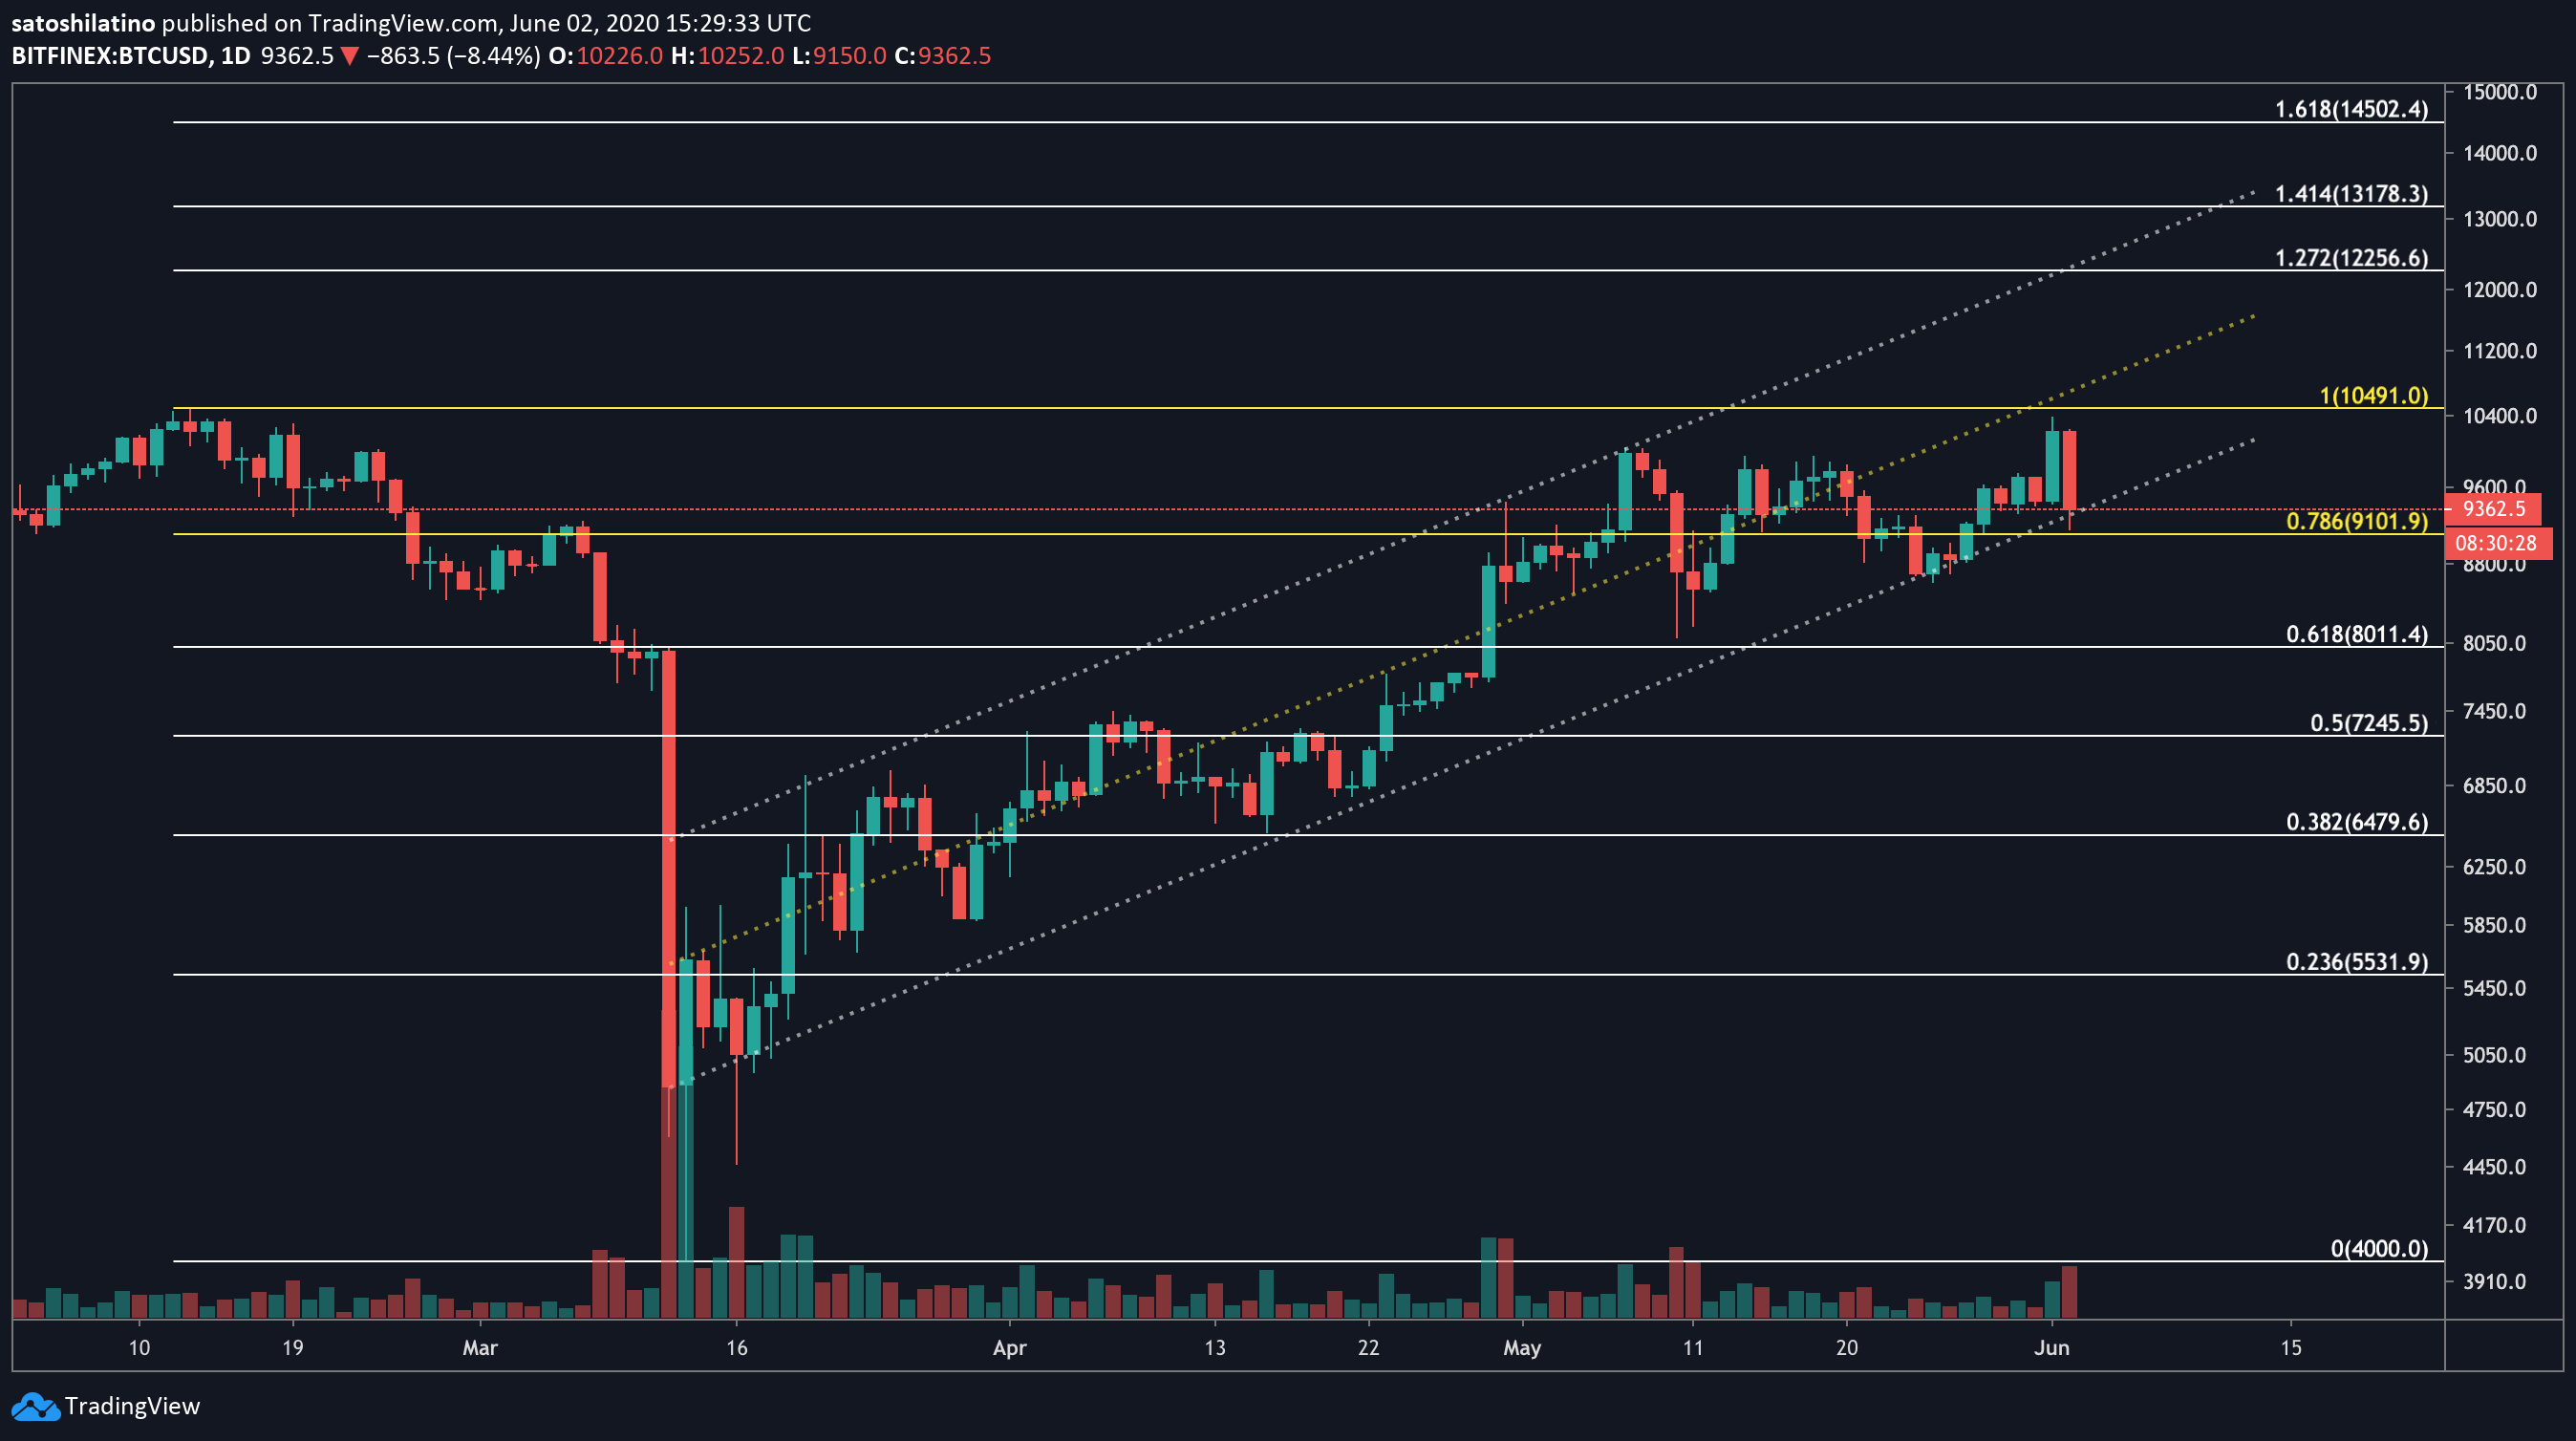
The Fibonacci retracement indicator adds credence to this outlook. Based on this technical index, Bitcoin may consolidate between $9,100 and $10,500 for an extended time before it provides a clear sign of where it is headed next.
Breaking below the support provided by the 78.6% Fibonacci retracement level could jeopardize the bullish view and trigger a steeper decline. Under such circumstances, the next critical support areas to pay attention to are 61.8% and 50% Fibonacci retracement levels. These support barriers sit at $8,000 and $7,300, respectively.
On the flip side, an increase in the buying pressure behind BTC that allows it to move past the $10,500 resistance could propel it towards new yearly highs.
It is worth mentioning that on BTC’s 1-week chart, the TD sequential indicator is currently presenting a sell signal in the form of a green nine candlestick. If it were to be validated, one could expect a one to four candlestick correction on the weekly chart before the continuation of the uptrend.
With all of these factors in mind, it is crucial to understand the support and resistance levels mentioned above to capture profits from the next major price movement.