- Uniswap price analysis indicates a bullish trend
- Resistance preset at $10.50
- Uniswap prices likely to break higher above $10.0
Uniswap price analysis confirms the firm bullish momentum for UNI/USD which is set to break higher above the $10 handle. The pair has been gradually grinding higher over the past few days, with buyers managing to keep control above the $9.50 level. This suggests that buyers are in control and could push the pair above $10 soon. The next key resistance level to watch is at $10.50, followed by $11.00.
If UNI/USD can break above these levels, it could see further upside momentum towards the $12.00 level. Conversely, a break below $9.50 could see the pair retrace back towards $9.00.
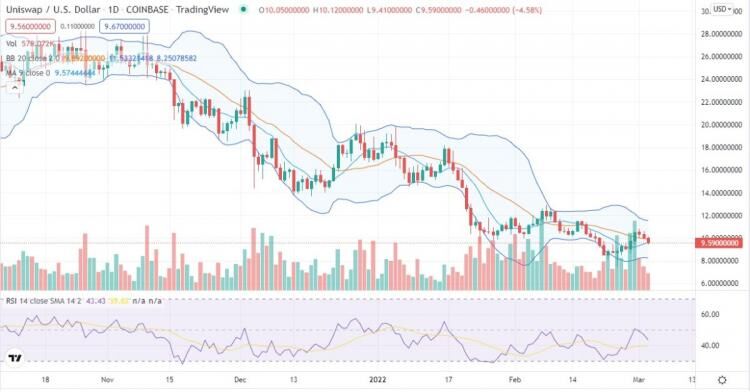
UNI/USD price analysis in the 1-day price chart: Bulls seem to have firm control of Uniswap price movement
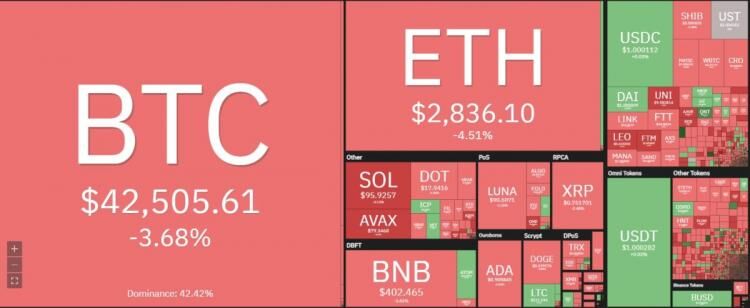
UNI/USD price action in the daily chart suggests a bullish momentum for Uniswap price. Bulls have been in control and were able to push the price above the $9.50 handle. The UNI/USD pair has been moving around a range of $9.00-$11.50 in the daily price chart. The trading volume has been gradually increasing, now at $576,686,340.03 an increase of 233.68 percent. This suggests that bulls are in control and could push the price past $11.00 soon. On the other hand, if the bears take over then the Uniswap price could drop below $9.00 and find support at $8.50.Overall, Uniswap is currently dominating 0.39 on the overall digital assets market, ranking position 22.
The technical indicators on the 1-day chart show the MACD line above the signal line, which is a bullish sign. The RSI is at 51.54, indicating that bulls are in control but are not oversold yet. This suggests that there is still room for the price to escalate upwards. The Bollinger bands are indicating a bullish trend for Uniswap prices and are not stretching towards the resistance price of $10.5. The Stochastic indicator is at 78.48, indicating that the price is in overbought territory but could still go higher. All in all, UNI/USD prices have adopted an uptrend in the 1-day chart and could see further advancement of Uniswap prices in the next coming days.
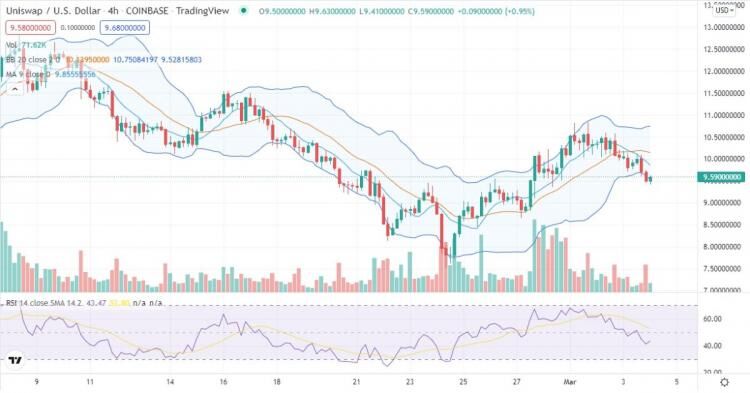
UNI/USD 4-hour price chart analysis: A bullish divergence is in place, suggesting that buyers are in control
According to the 4-hour price chart analysis, UNI/USD pair shows a strong bullish divergence in place, with price making lower lows whilst RSI making higher lows. This suggests that buyers are in control and could push the pair above $10 in the near future. The technical indicators are all biased bullish, with the MACD line above the signal line and the RSI at 57.54.
The EMAs are all pointing up, indicating that the price is in an uptrend. The Bollinger bands are also biased bullish, with the price increasing and relatively low market volatility as the Bollinger bands are not fully stretched. The Stochastic indicator is at 73.48, indicating that UNI/USD pair is in overbought territory but could still move higher.
Uniswap price analysis conclusion
According to Uniswap price analysis, bullish winds are blowing for UNI/USD. Uniswap’s current bullish trend has been witnessed in the previous analysis as per reports, hence giving bulls a great opportunity to invest in the market. The indicators are all signaling a buy for UNI/USD and with the price being at a good entry point, it is would be a better idea to buy at this point.
The information provided is not trading advice. Cryptopolitan.com holds no liability for any investments made based on the information provided on this page. We strongly recommend independent research and/or consultation with a qualified professional before making any investment decisions