After days of stagnation and consolidation, Bitcoin started to mount a strong comeback earlier this week.
The leading cryptocurrency now trades for $9,650 — the highest price in over a week and more than 13% higher than the ~$8,550 lows seen during a retracement earlier this month.
But Bitcoin remains below a crucial region of resistance that analysts say could unlock upside not seen since 2019 if BTC manages to reclaim the zone as support.
The Importance of $10,500 to Bitcoin
As arbitrary as this number may sound, $10,500 is one of the most important price levels for Bitcoin at the moment.
As can be seen below, prices in the vicinity of that level have rejected Bitcoin during many rallies over the past year.
$10,500 marked the top of the “Xi pump” seen in late 2019, while it also marked the top of the rally seen earlier this year.
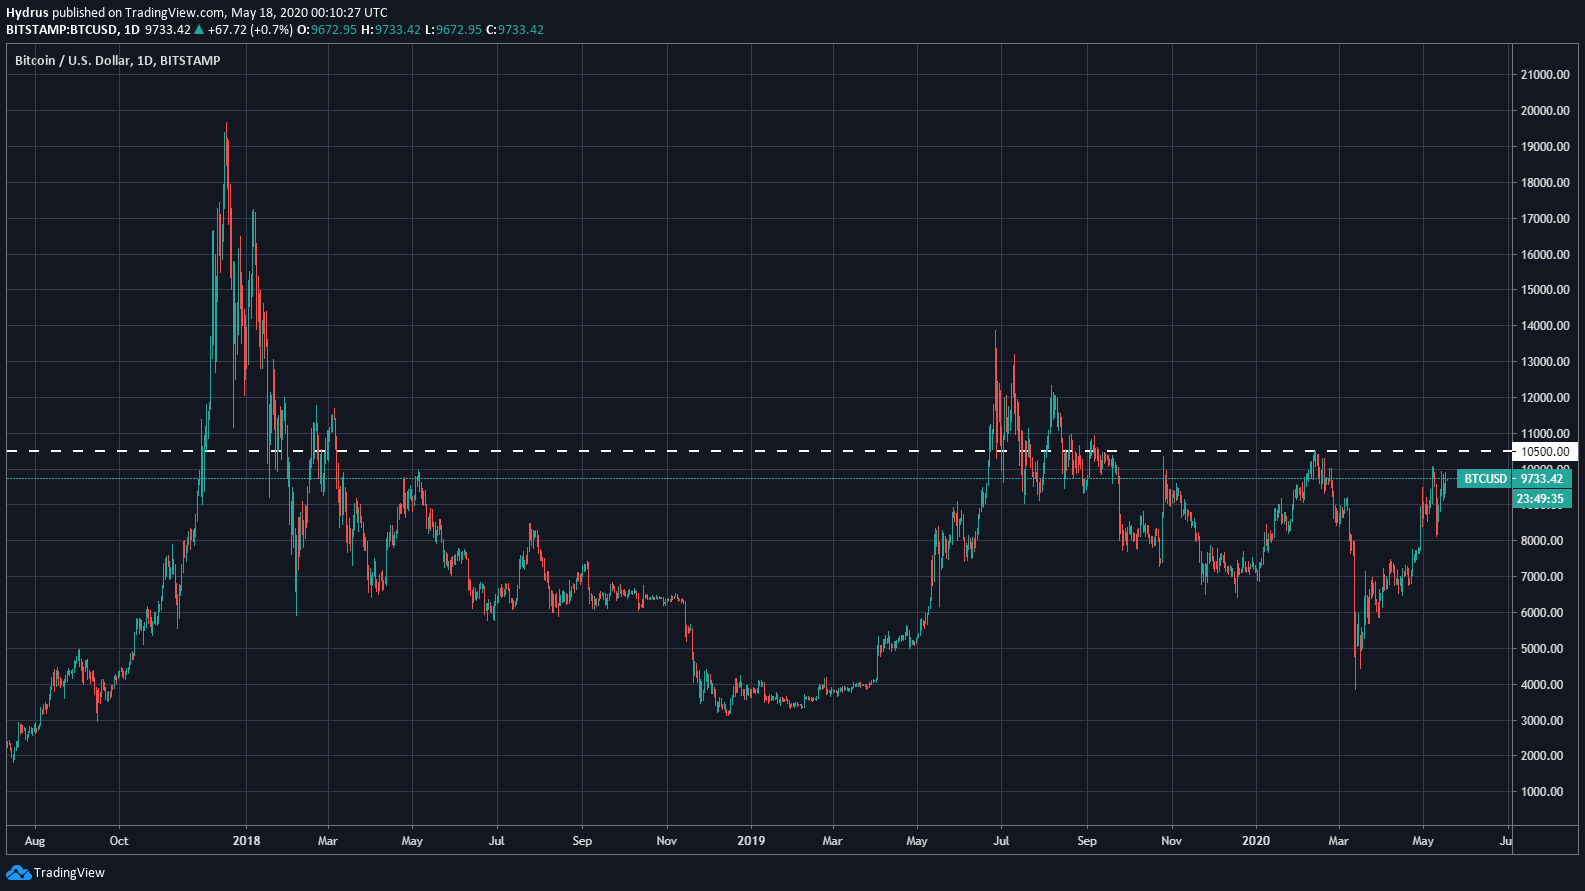
Chart from TradingView.com illustrating the importance of the $10,500 level for Bitcoin over the past few years.
The price is also a point at which a number of crucial bearish Bitcoin chart formations would become invalidated, leaving room for BTC to rally to the upside. As one commentator explained:
“BTC very close to exploding. Break above $10,500 would break an over 2 year symmetrical triangle, 11 month broadening wedge, 8 month horizontal resistance.”
Considering the importance of the level, it should come as no surprise that analysts have said that if Bitcoin can break above $10,500, a strong upswing could follow.
Robert Sluymer of Fundstrat Global Advisors recently made the following comment on the importance of the level:
“Next directional move on tap for BTC’s as bull-bear convictions are about to be tested. Bears can point to the downtrend at 10-10.5K. Bulls have the long-term uptrend (200-week sma) at their back and the past week’s resilience as BTC’s quickly rebounded from its 200-dma.”
Next directional move on tap for $BTC‘s as bull-bear convictions are about to be tested. Bears can point to the downtrend at 10-10.5K. Bulls have the long-term uptrend (200-week sma) at their back and the past week’s resilience as BTC’s quickly rebounded from its 200-dma. pic.twitter.com/QrZ4SxYsxR
— Robert Sluymer (@rsluymer) May 14, 2020
It Won’t Be Easy
Although all eyes may be on $10,500, that’s not to say that the level will be easy for Bitcoin to break past.
Order book data from Bitfinex’s flagship BTC/USD market shows that there is currently a confluence of sell-side orders around $10,000-10,300.
This has been illustrated by the chart seen below, which was shared by a prominent crypto trader. It shows the price action of BTC since the start of the year coupled with the “OB (order book) Dominance Bands” indicator.
The indicator shows the price points at which there is order book activity, with the opacity of the bands showing how significant that activity is.
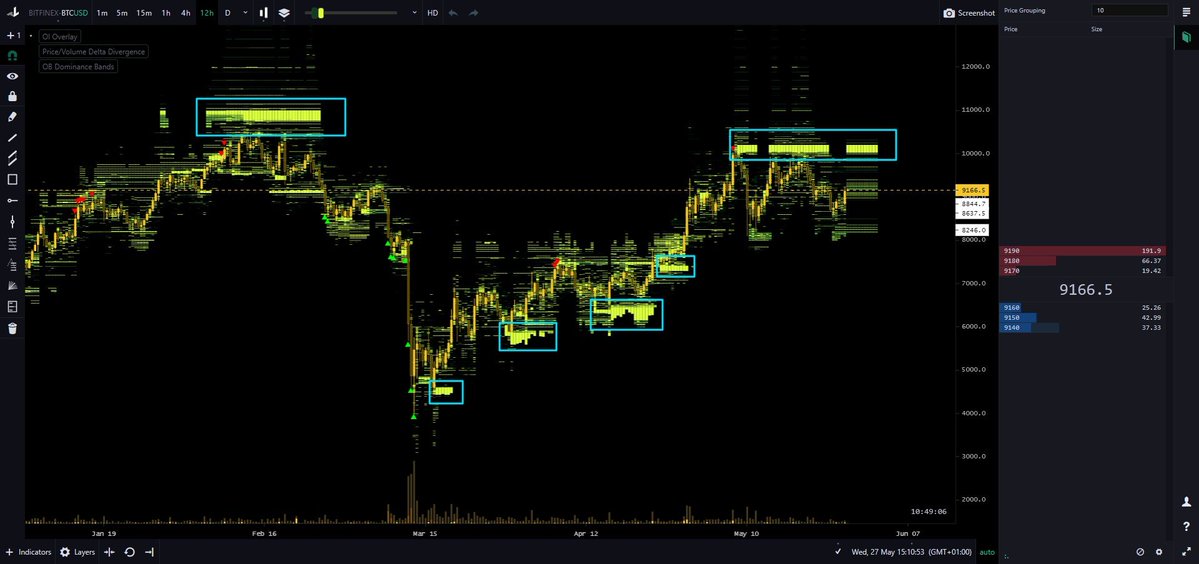
Chart from crypto trader Coiner-Yadox (goes by @Yodaskk on Twitter).
The order book data is relevant as it predicted previous price action in the Bitcoin market.
Featured Image from Shutterstock