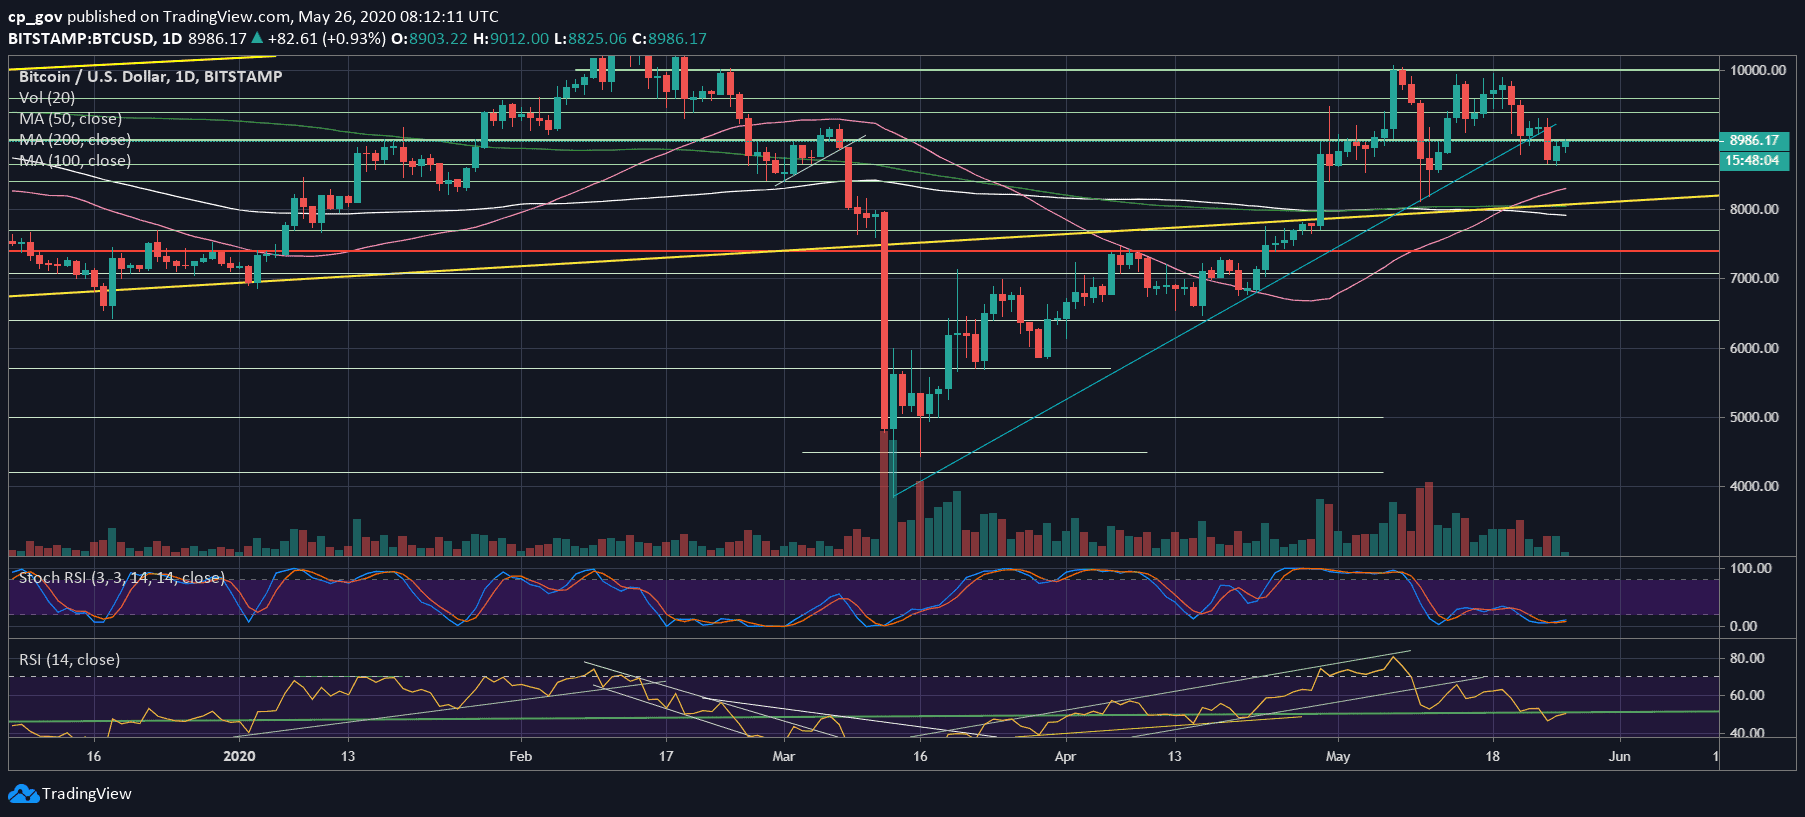
Quick recap: A week ago, after failing to break the $10,000 benchmark, Bitcoin price had dropped back to the $9200 – $9300 support, where lied the critical ascending trend-line, the one that started developing since the March 12 price crash (colored blue on the following daily chart).
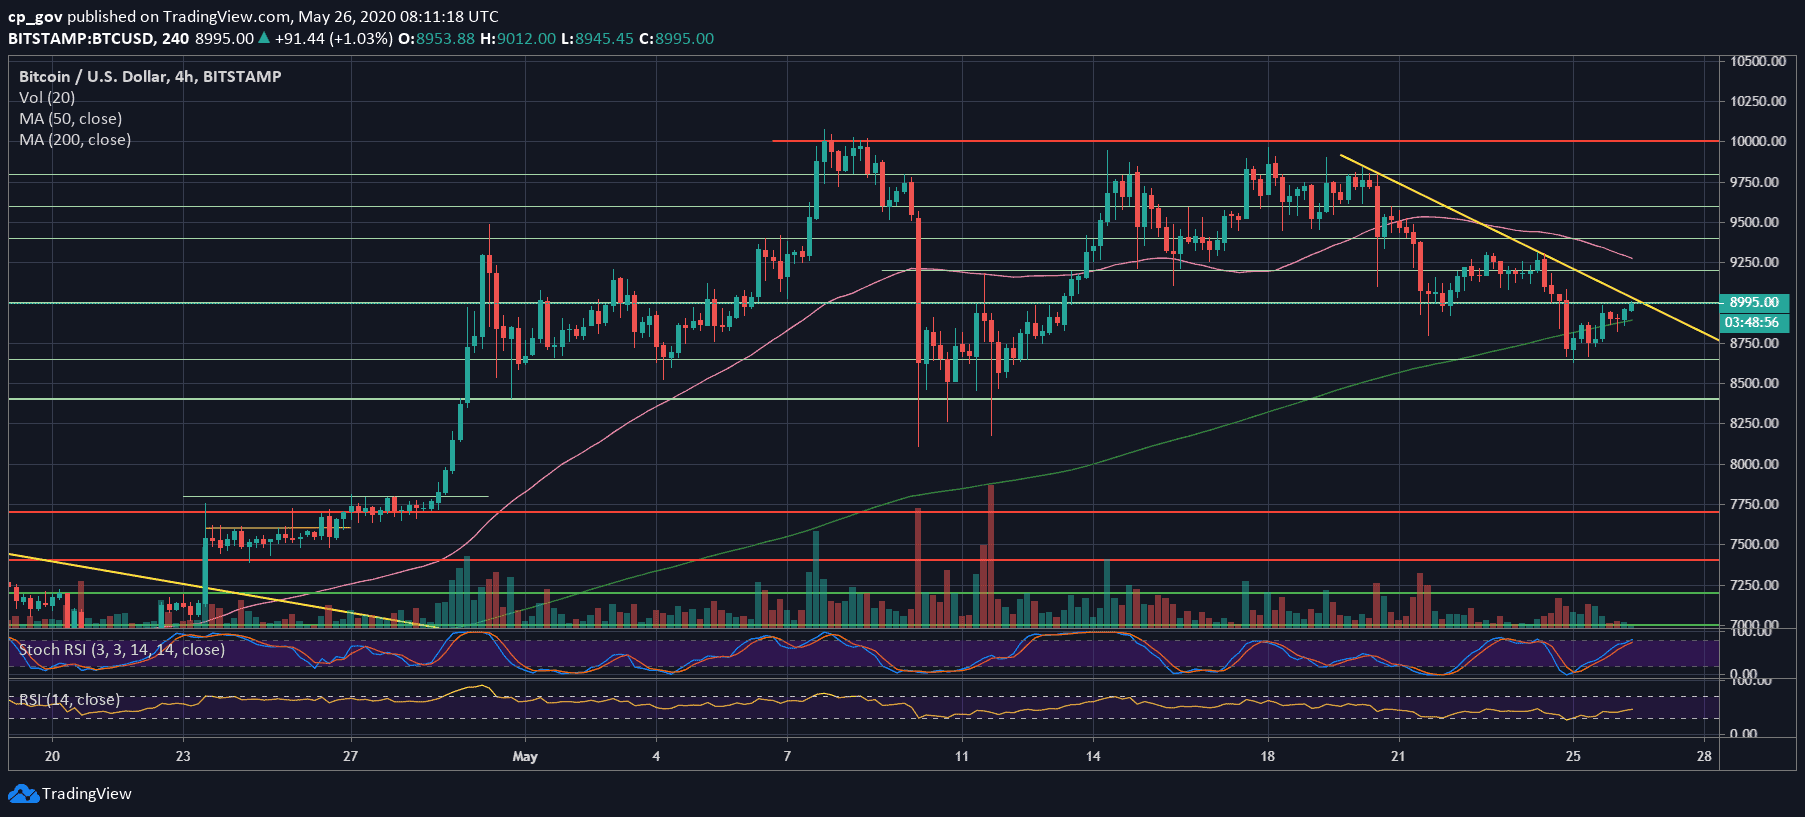
Last Sunday, Bitcoin failed to hold the mentioned support at $9200 – $9300 and dropped to a current weekly low at $8650. Yesterday, we stated that $8800 – $9000 now becomes a strong resistance zone, and the short-term confluence zone.
As can be seen on the following chart, yesterday’s high almost touched $9000, which is the upper boundary of the confluence zone.
Decision – Soon
As of writing these lines, Bitcoin trades inside the $8800 – $9000 zone. We can assume that once a breakout takes place, it is likely to set-up the short-term direction for the primary cryptocurrency.
The indecisive phase is also seen by the RSI indicator on the daily chart. After breaking down from the 50 critical mark, the RSI got rejected when attempted to break above it (just like the $9000 mark for Bitcoin’s price).
The next indicator is the trading volume. Over the past two weeks, the volume is declining. Even Sunday’s drop volume was not significant (which is in favor of the bulls); however, the next direction will be decided only when real volume shows up.
In case the bulls would like to signal they are in control, we would need to see RSI above 50, along with the price breaking $9K followed by a high amount of volume.
Besides, this new week’s candle is trading below the long-term ascending trend-line, which was started forming in January 2015. It is critical for Bitcoin to close this weekly candle above the line ($9K+).
Bitcoin Short-term Support and Resistance Key Levels
As mentioned above, Bitcoin is trading between $8800 and $9000. In case of a break-up, then the next significant resistance is the tough support turned resistance level at $9200 – $9300 zone, which it failed to break up during the last weekend.
In case Bitcoin breaks down the $8800, then yesterday’s low around $8600 is the first level of support, followed by $8400 – $8450. Further below lies the 50-days moving average line ($8280), marked by pink line, along with horizontal support of $8000 – $8200 (May’s low).
Total Market Cap: $249.7 billion
Bitcoin Market Cap: $164.0 billion
BTC Dominance Index: 65.6%
*Data by CoinGecko
BTC/USD BitStamp 4-Hour Chart
BTC/USD BitStamp 1-Day Chart