Just two months ago, Bitcoin was trading at $3,700. Amid a liquidation event in traditional finance and growing fears of a recession and a pandemic, global markets were tanking, crypto included.
But just eight weeks and a block reward halving later, BTC just recently traded at $10,000 — just over 170% higher than the March capitulation lows.
It’s a stunning reversal that has analysts anticipating more upside. But according to a leading trader, there are four clear market trends indicating that for the time being, Bitcoin will see a “dip,” likely to the $8,800-9,100 level.
They are as follows.
#1: There’s a “Thick” Bitcoin Sell Wall Near $10,000
Bitfinex’s order book for its BTC/USD market, as reported by NewsBTC, is currently showing there is a colossal block of resistance around $10,000, which will halt any short-term rally in the Bitcoin price.
The data suggests that from $9,900 to $10,600, there is ~4,200 Bitcoin worth of sell orders, the majority of which are clustered in and around $10,000-10,400.
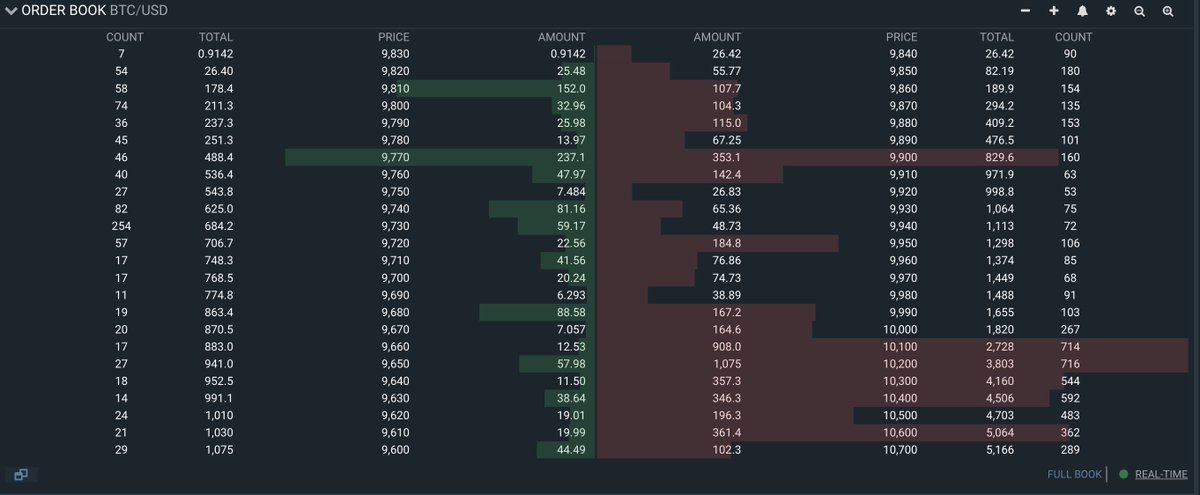
Order book (BTC/USD) screenshot from Majin (@Majinsayan on Twitter), a prominent Bitcoin trader.
Similar sell-side walls were spotted on other top exchanges, indicating that deep pockets don’t want Bitcoin moving past $10,000 just yet.
#2: Funding Rates on Futures Exchanges Are Moving Higher
As reported by NewsBTC, one leading crypto chartist recently shared the data below, indicating that the funding rate of the Bitcoin futures contracts on OKEx — funding being the fee that long positions pay short positions — has “suddenly [trended] very high again.”
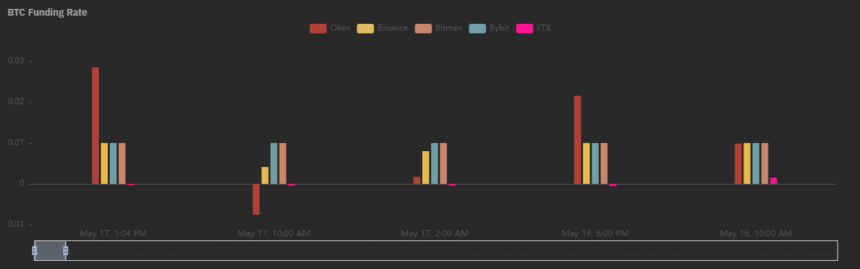
Image Courtesy of Byzantine General
High funding rates coincide with market tops as it signals that long positions are overleveraged and, thus, are susceptible to being squeezed out of their positions by bears.
#3: Fear & Greed Index Hits 2-Month High
The Bitcoin “Fear & Greed Index” — which weighs factors like volume, social media sentiment, and more to try and determine how optimistic investors are feeling — recently hit a two-month high of around 50 points, according to the bearish trader.
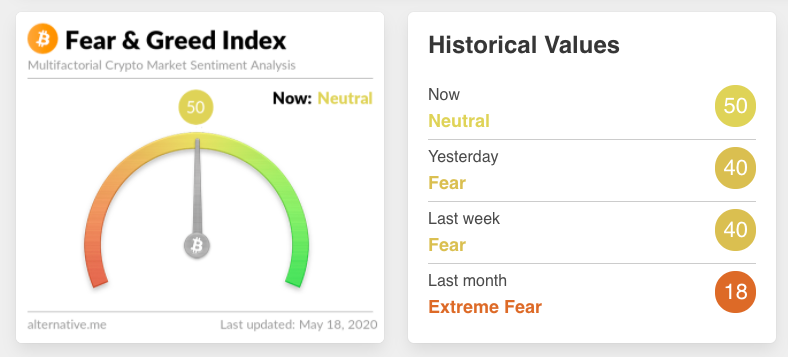
Bitcoin Fear & Greed Index hitting two-month highs, according to trader Theta Seek.
While the index is not yet in the “greed” side of the gauge, analyses have found that high readings of this index have coincided with short-term and medium-term market tops.
#4: Spot BTC Volume Is Decreasing
Late last month when Bitcoin broke past $10,000 for the first time since February, Bitwise’s volume dashboard registered nearly $5 billion worth of spot trading volume in a single day.
That same dashboard now registers spot trading volume as $1.7 billion in the past 24 hours, indicating a strong decrease in market activity.
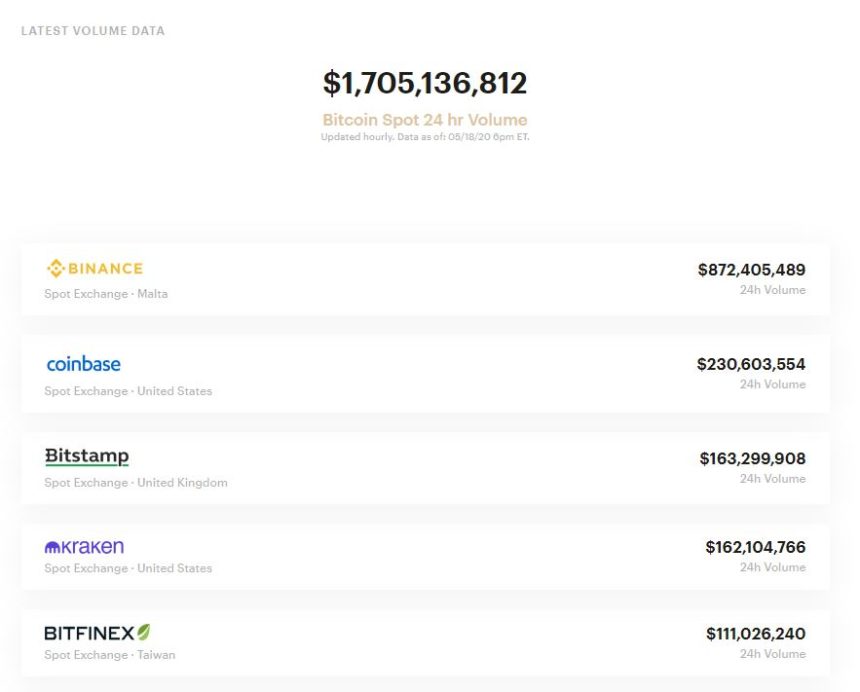
Bitwise’s trading volume dashboard as of May 18.
This indicates that much of the momentum that the crypto market had to bring BTC from $3,700 to $10,100 has been lost, with derivatives trading accounting for much of the recent price action.
Photo by Elliott Engelmann on Unsplash