- Omisego remains among the best-performing cryptocurrency this week following a massive 35% surge in a few days.
- The bulls regained control of the market after a week downward correction.
- After touching $1 mark today, the price is now facing crucial resistance levels.
OMG/USD: Omisego Touched $1 After Huge Breakout
Key Resistance Levels: $1.14, $1.372
Key Support Levels: $0.945, $0.81
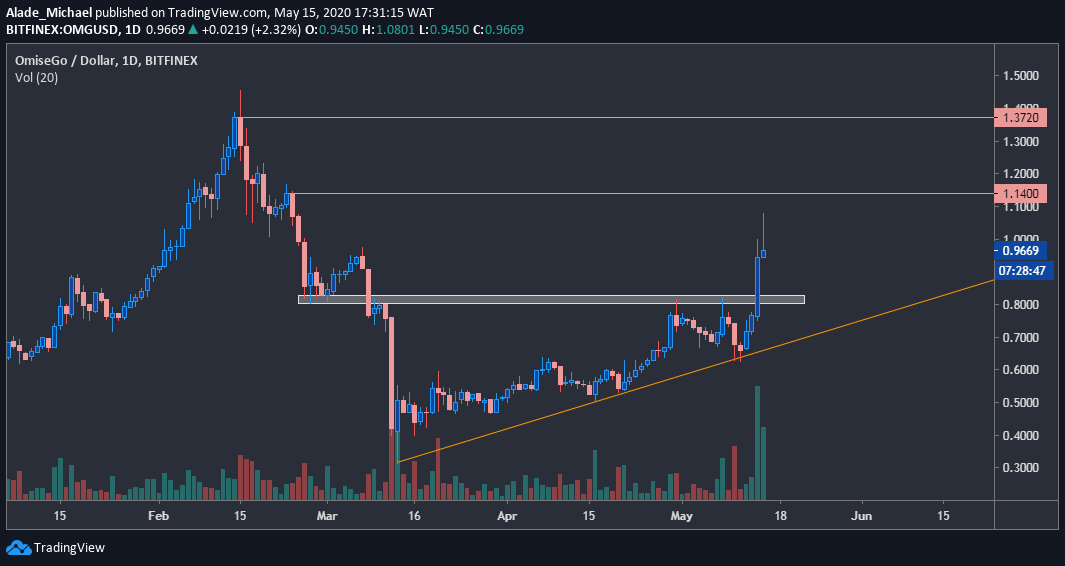
The latest surge in Omisego’s price was characterized by a strong bullish candle (from $0.61 to $1.05), following a massive 38% increases over the past five days trading.
The price has dropped slightly to $0.96 at the time of writing. From a fundamental perspective, the major reason for this surge can be traced to the fact that Coinbase Pro has added the cryptocurrency for trading.
However, yesterday’s breakout is now setting a fresh bullish tone for Omisego. As can be seen on the daily chart, the price is well above a minor supply-turned-demand at $0.81 – indicated grey.
From a technical perspective, the latest price increase was triggered by a nice rejection around $0.6 level and, most importantly, finding a short rebound at the orange rising trend line. This suggests that more gains can be expected if Omisego keeps the surge.
Omisego Price Analysis
Omisego is currently facing the $1.14 resistance level after opening slightly below March’s high today. If the price continues to rise in the coming days, the OMG/USD pair is most likely to revisit $1.372 support, which was flagged in February.
A significant break above the current 2020 high of $1.5 would confirm a mid-term bullish trend.
At the moment, Omisego is relying on daily support of $0.945 (the opening price on Bitfinex). However, the price may slip to a key psychological level at $0.9 in case of a drop. The major pullback level to watch is the grey support area of $0.81, where the weekly breakout occurred a few hours ago.
However, the trend would be considered bearish if the price manages to drop below the orange rising trend line. Technically, the trend is currently bullish on the daily chart.
OMG/BTC: Omisego Regains Momentum At 7000 SAT Level
Key Resistance Levels: 11449 SAT, 12111 SAT, 13369 BTC
Key Support Levels: 9300 SAT, 7500 SAT, 7000 SAT
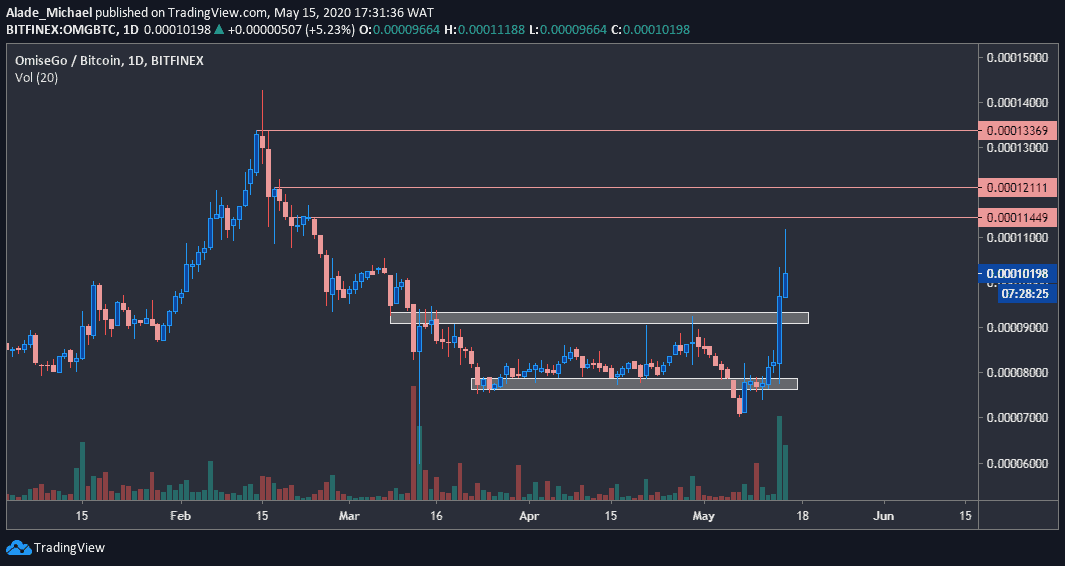
While major altcoins are crashing to new lows against Bitcoin, Omisego appeared strong as it continues to increase over the last week. The price touched a daily high of 11000 SAT with a 3.6% growth in under 24 hours.
After dropping below 7500 SAT on May 6, Omisego found a new low around 7000 SAT and regained strength back above the 8000 SAT, 9000 SAT level, and 10000 SAT level, respectively.
The price is currently changing hands around 10600 SAT. With the latest reverse pattern, more bullish actions can be expected in the next few days. However, it may be difficult for the bulls if the price later slumps under the 9000 SAT level.
Omisego Price Analysis
The closest resistance for the OMG bulls is 11449 SAT and 12777 SAT if the price keeps rising. Reclaiming these levels would propel more gains to the 13369 SAT level (February 15 opening price).
Omisego is likely to start a new increase if the price climbs above 14269 SAT (current 2020 high).
Should the price falls beneath the 10000 SAT level, there’s a key demand area at 9300 SAT level – the first grey spot on the daily chart. The next support below this is the second grey area of 7500 SAT, followed by 7000 SAT, where the price started to recover on May 8.