AR coin price shows an uptrend in action, which struggles to close above $30 resulting in higher price rejection. Will the uptrend reach 50-day EMA?
Key technical points:
- The 200 and 100-day EMA are on the verge of giving a bearish crossover
- The RSI slope surpasses the 14-day SMA
- The 24-hour trading volume in the Arweave token is $71.9 Billion, indicating a 125% rise.
Past Performance of AR
After the $30 breakout after the rejection faced near the 200-day EMA, the AR coin price reached $23 with multiple bearish candles. The buyers make a comeback and retest the $30 level. However, the sellers keep the bullish attempt in check resulting in a sideways movement below the resistance level. 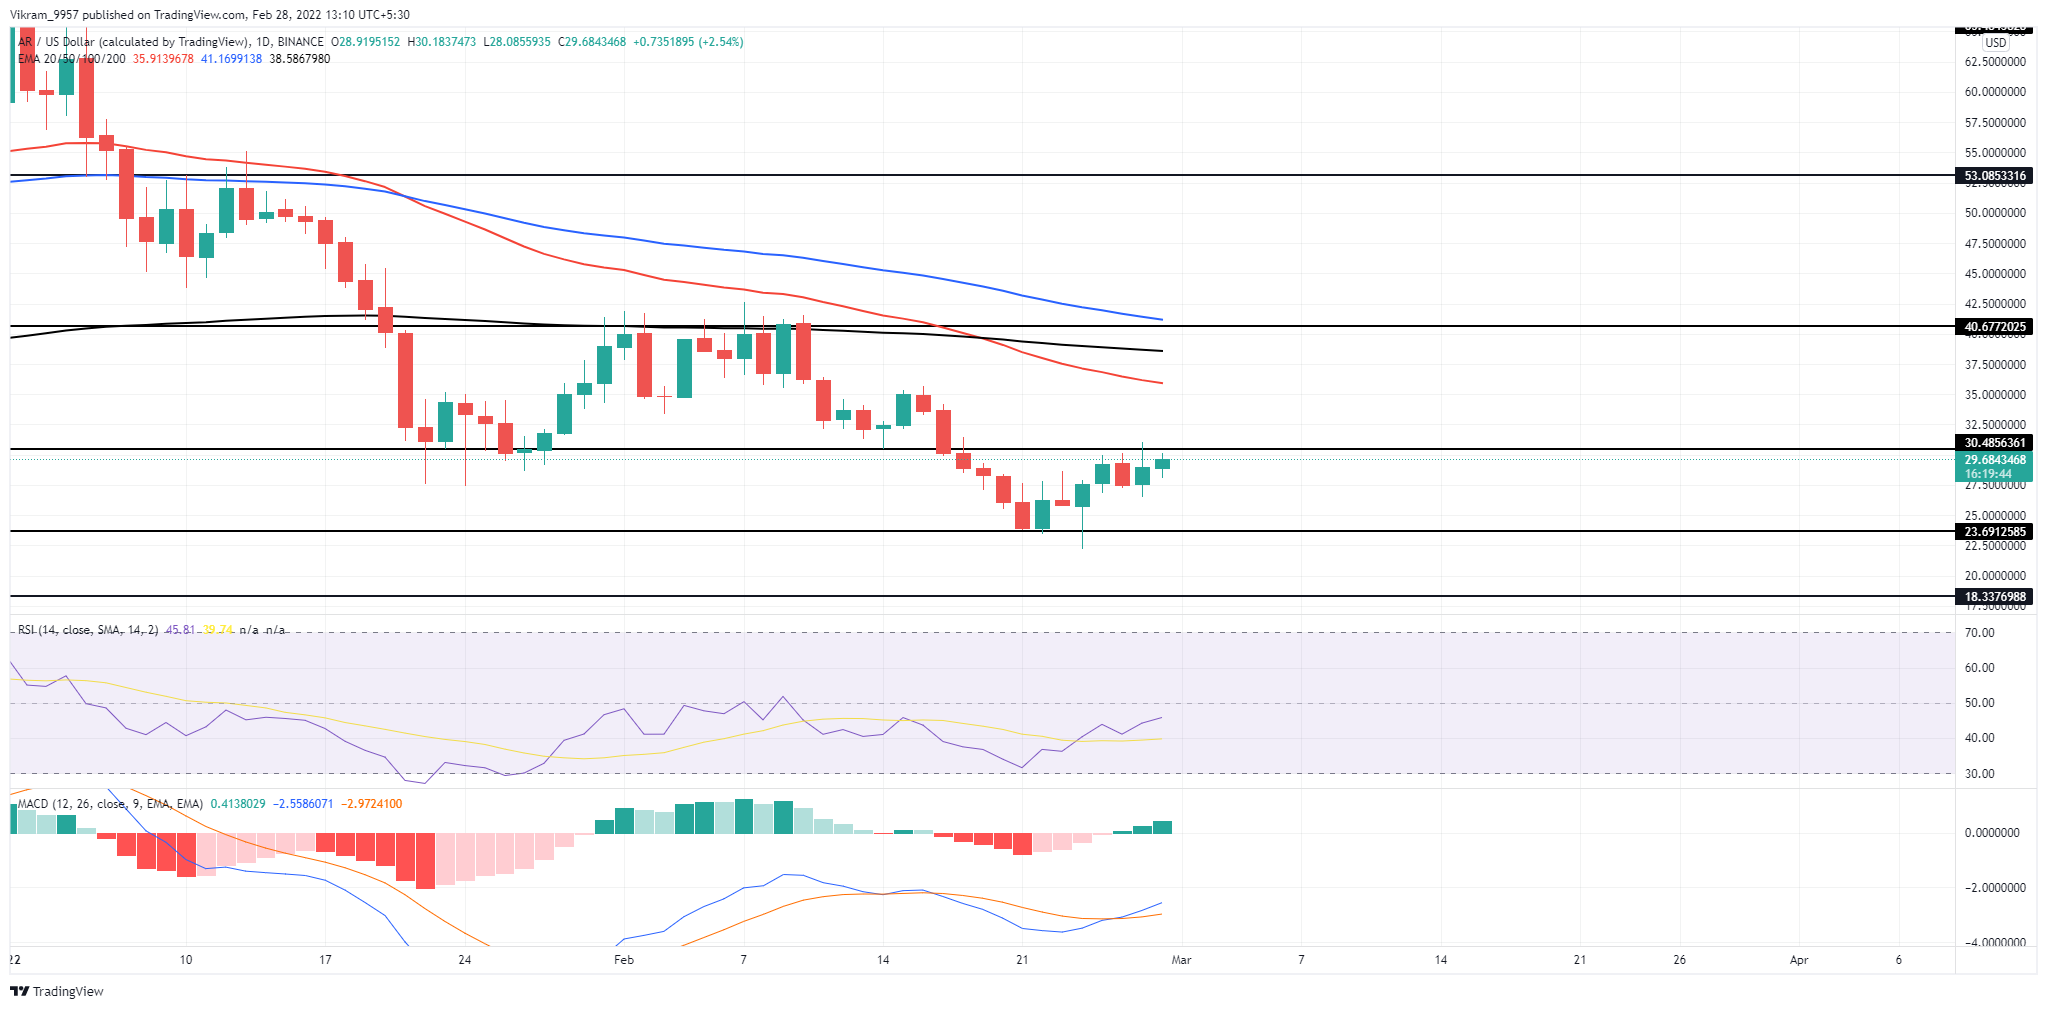 Source-Tradingview
AR Technical Analysis
The AR coin price action shows higher price rejection with the possibility of a bearish continuation back to the $23 mark. Moreover, if the sellers dominate $23, the breakout of $20 becomes possible and reaches the $18 mark. The uptrend in the Arweave coin price struggles to avoid the 100 and 200-day EMA, with the 50-day falling below to provide a potential dynamic resistance. Therefore, traders can expect a selling opportunity near the 50-day EMA. The MACD indicator shows a rising trend in bullish histograms, with the fast and slow lines attaining a bullish alignment with a crossover. Hence, the indicator projects the possibility of bulls taking over the $30 mark. The RSI Indicator slope approaches the halfway mark and surpasses the 14-day SMA indicating a boom in buying pressure. However, the previous rejections above the central mark project a selling pressure area that can induce bearish tensions on the upcoming trend. In a nutshell, the AR technical analysis reflects a neutral state, and the breakout of $30 or a downfall below $27 will indicate a trading signal.
Upcoming Trend
The AR coin price shows the possibility of a bullish continuation with a breakout of $30. However, the selling pressure moving with the 50-day EMA can help the bears resurface. Nonetheless, the closing above $30 will generate a short-term buying signal. Support Levels: $28 and $13 Resistance Levels: $35 and $40