- Tezos undergoes a correction across its trading pairs as buyers wait to reiterate actions.
- A strong rebound at the ascending trend line would validate a continuation for XTZ bulls.
- The price is trading near a key psychological level, but bears are looking for more gains.
XTZ/USD: Tezos Correcting At 7-Week Trend Line
Key Resistance Levels: $2.88, $3
Key Support Levels: $2.57, $2.37
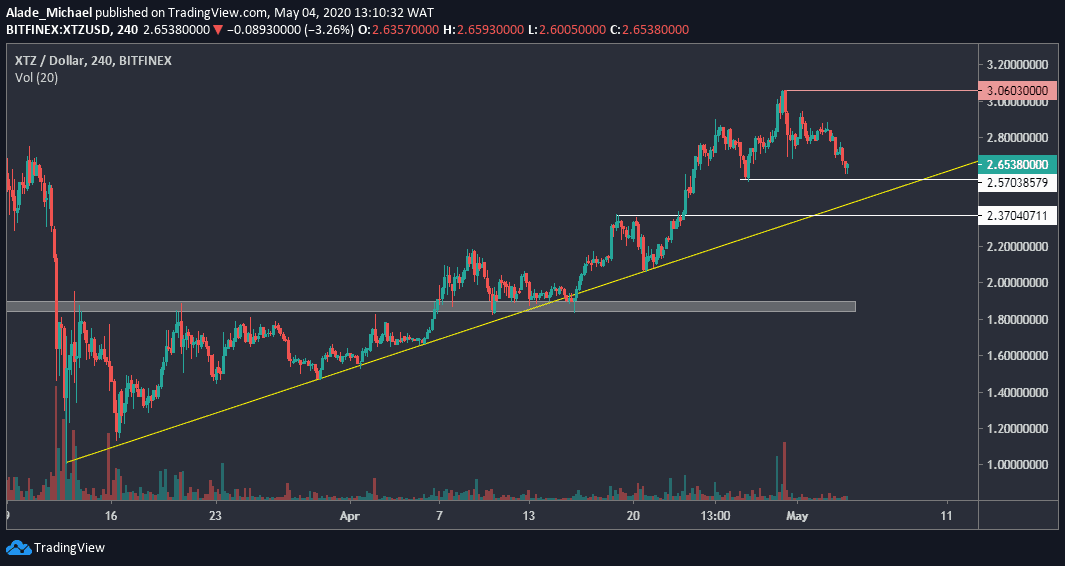
Last week, Tezos touched $3 following 200% gains in seven weeks. But currently, the 10th largest cryptocurrency is undergoing a correction following a loses overnight. This correction is led by a 6% drop in Bitcoin’s price.
Due to this bearish action, Tezos is now trading around $2.82 mark and above the weekly support at $2.57. Even if the support breaks, there’s hope for a rebound at the 8-week ascending line, marked yellow on the 4-hours chart.
A breakdown could occur, however, if the yellow line fails to provide a rebound for Tezos, it might lead to a serious colossal drop in price. But as of now, Tezos’s bullish trajectory remains valid on the 4-hours time frame.
Tezos Price Analysis
While Tezos approaches the support at $2.57, indicated white on the price chart, the next support to keep in mind is right beneath the yellow ascending line at $2.37 in case of a breakdown.
From here, the bearish correction may extend to key support levels at $2 and $1.8 (in the grey demand zone) if Tezos continues to fall.
A nice rebound at the yellow ascending line would signal a fresh bullish cycle, which is likely to reach $3.5 on the upside. But the key resistance, for now, is located at $2.88, followed by April high of $3.06 – labelled red in the above chart.
XTZ/BTC: Tezos Trading At Psychological Level
Key Resistance Levels: 37940 SAT, 40000 SAT
Key Support Levels: 27860 SAT, 25000 SAT
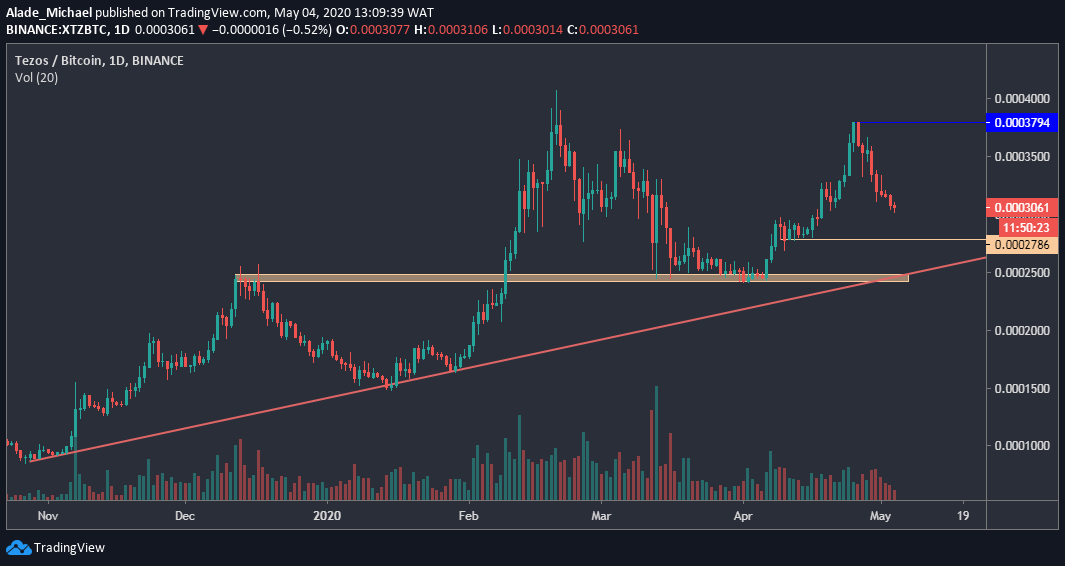
Since our previous analysis, Tezos continued to show a lot of weakness as bears look for more selling opportunity in the market. Inversely, buyers are provided with a good discount rate.
Against Bitcoin, Tezos’s price lost momentum all the way from 37940 SAT on April 26, as the bears resume pressure.
A continuous sell action could trigger more losses to key price levels. Considering the red ascending trend line forming since Late October 2019, Tezos’s mid-term bullish is still looking positive on the daily chart.
A mid-term bearish reversal would be considered as soon as Tezos crosses down this significant red line
Tezos Price Analysis
In the meantime, the daily support to watch for now is the initial orange line of 27860 SAT, followed by the orange demand area of 25000 SAT, which currently corresponds with the red ascending line. Support below here is 20000 SAT and 15000 SAT in case of a breakdown.
If Tezos manages to recover from the current price level of 30000 SAT, the buyers would target 37940 SAT resistance in the next bullish actions. Resistance above this lies at 40000 SAT level, which remains the yearly high.
A huge price movement should be expected once this resistance breaks. At the time of writing, Tezos is technically in a downward spiral.