- Price has been lowered to $133.46.
- Litecoin price analysis confirms downtrend.
- Support is present at $95.41 low.
The latest Litecoin price analysis gives an optimistic prediction for the bears as they have successfully secured the winning seat once again. The market has been following a strong bullish trend for the past week, intensifying the bullish momentum. But now, it seems that the selling momentum is recharging as the cryptocurrency experienced a loss in its market value up to $133.46 extreme.
LTC/USD 1-day price chart: Price travels low as selling momentum renews
The one-day Litecoin price analysis gives a negative hint regarding the ongoing market trends as a decline in coin value has been observed. The bearish rally disrupted the bullish wave, as the sellers are trying to make way towards a comeback. As the selling activity is seemingly expanding, the LTC/USD value has been lowered up to the $133.46 mark. In contrast, the moving average (MA) value stands at a lower position, i.e., $129.05.
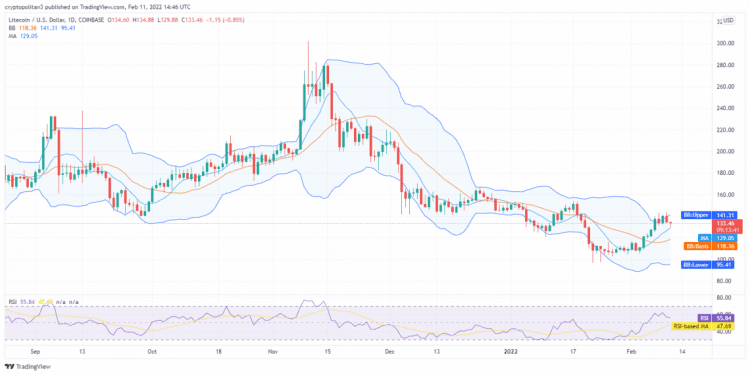
The volatility is increasing, which means that the current downtrend might extend even further in the next week. The upper Bollinger band value is thus at $141.31 now, whereas the lower Bollinger band value is $95.41. The Relative Strength Index (RSI) score has been reduced to 55.84 because of the decreasing trend.
Litecoin price analysis: Bulls retrieve coin value up to $133.44 bar
The four-hour Litecoin price analysis confirms an uptrend as the coin value experienced a considerable rise in the past few hours. This is rather encouraging news for the cryptocurrency buyers as earlier; the bearish resistance was quite high. Currently, the buyers are clearing up as the cryptocurrency value has been recovered up to $133.44 high. Moreover, if we discuss the moving average value, it stands at $136.05 in the 4-hour price chart.
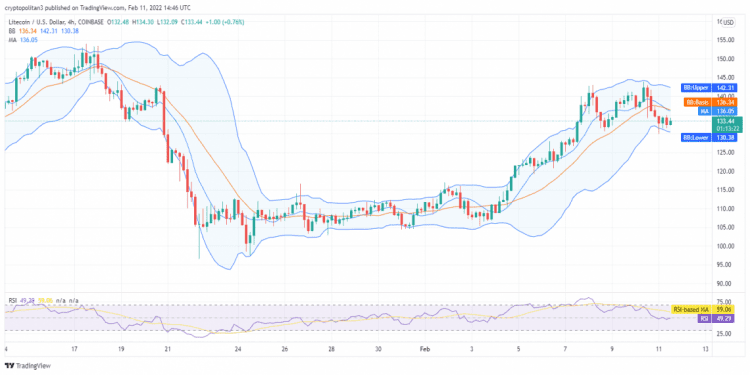
The short-term trending line is still moving in the descending direction as earlier; the circumstances were quite unfavorable for the bulls. The upper value of the Bollinger bands indicator is at $142.31, whereas its lower value is at $130.38. At the same time, the RSI score is in a quiet neutral zone as it just reached 49.29 because of the latest upturn in the price.
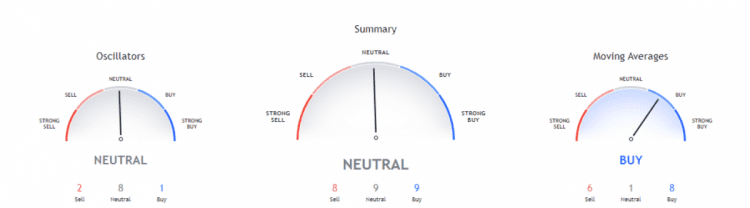
The market trends have constantly fluctuated because of the rise and fall in price. Both the bulls and the bears have been striving for the lead, which can be further confirmed from the above indicators ratio. The technical indicators chart shows a neutral trend as nine indicators are there on both the neutral and buying positions, while eight are present on the selling position.
The Moving Averages Indicator displays a bullish signal as eight indicators are resting on the buying side, six indicators on the selling, and one indicator is there on the neutral side. The Oscillators are again predicting a neutral price trend for the day as eight oscillators are on the neutral point, two are on the selling, while only one oscillator is on the buying point.
Litecoin price analysis conclusion
The one-day and the four-hour Litecoin price analysis predicts a bearish trend for the day as the price covered a downward movement in the past 24-hours. Although the bullish wave was traveling quite swiftly in the last week, today, the coin value decreased up to the $133.46 mark. On the other hand, the hourly price analysis shows a bullish inclination as the coin value improved over the past four hours.
Disclaimer. The information provided is not trading advice. Cryptopolitan.com holds no liability for any investments made based on the information provided on this page. We strongly recommend independent research and/or consultation with a qualified professional before making any investment decisions.