- Coin value is standing at $3.89.
- Tezos price analysis shows uptrend.
- Support is strong at $2.563.
The latest Tezos price analysis supports the buyers as the price covered an upward movement in the last 24-hours. This is being further indicated by the one-day price chart, where the price just crossed the resistance present at $3.89. The bulls have been reigning in the market for the past few weeks, and a consistent bullish trend has been followed by cryptocurrency. Currently, the circumstances seem favorable for the bulls, and a strong uptrend is happening.
XTZ/USD 1-day price chart: Upside continues as price targets next aim above $3.89
The one-day Tezos price analysis is showing a strong bullish trend for the day as the buying momentum seems to be intensifying. Green candlesticks are marking the one-day XTZ/USD price chart, which is indicative of an increasing trend. Currently, the coin value is $3.890, and it is highly expected that it will reach a higher goal in the upcoming days. The moving average (MA) is now standing lower than the current price, i.e., $3.45.
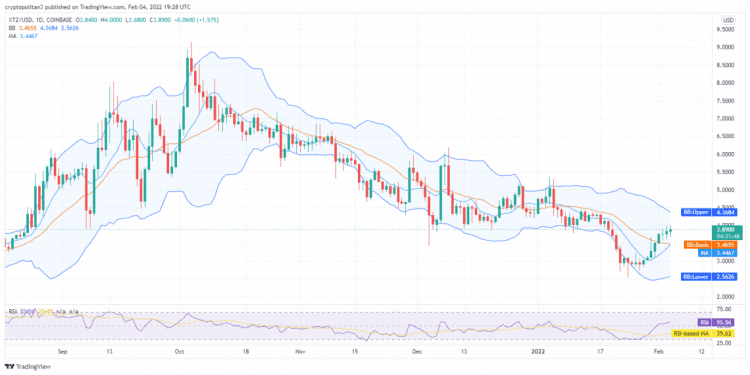
A crossover between SMA 20 and SMA 50 curves is taking place, which is a huge bullish indication and a great accomplishment for buyers. Moving on towards the Bollinger Bands Indicator, the upper value is at $4.37, whereas the lower value is at $2.56. The Relative Strength Index (RSI) graph shows an upward curve as the score just heightened up to 55.56.
Tezos price analysis: Cryptocurrency value downgrades to $3.90 after bearish turn
The hourly Tezos price analysis shows a drop in cryptocurrency value as the bears could make a comeback in the past few hours. The market trends have constantly fluctuated, but now the bears are seemingly in the leading position. A substantial drop in XTZ/USD value was recorded in the past four hours as the price declined up to $3.90. The moving average value, i.e., $3.84, is still standing at a higher level than the price levels.
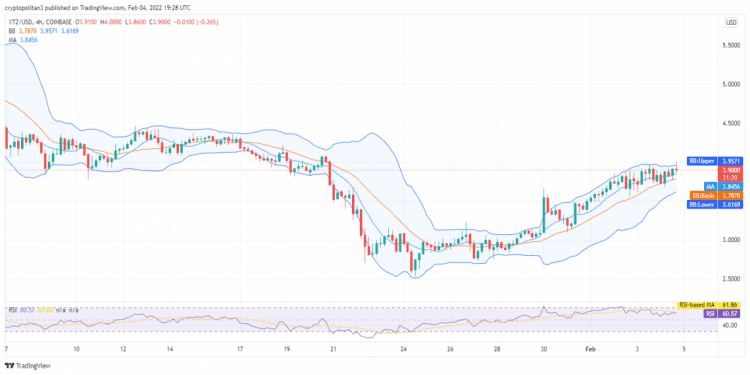
The volatility is decreasing in the hourly price chart, which means that future market trends might favor the bulls. The upper Bollinger band is now touching the $3.96 end, whereas the lower Bollinger band is at the $3.62 end. The RSI score is still quite close to the over-bought limit as it is currently standing at 60.57.
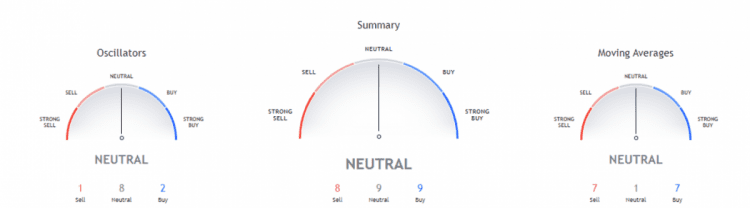
Overall, the market trends have constantly varied for the past few months. The bulls and bears are struggling for lead, which is why the technical indicators chart predicts a neutral trend for XTZ/USD. We can see that nine indicators stand on the neutral and buying ends, whereas eight are on the selling end.
The Moving Averages Indicator is giving out a neutral hint regarding the market situation. Seven indicators occupy the selling and buying points, whereas only one indicator is there in the neutral position. The Oscillators are also predicting similar price trends and eight oscillators are on the neutral side, two oscillators on the buying, whereas only one oscillator is on the selling side.
Tezos price analysis conclusion
The one-day and four-hour Tezos price analysis predicts a tremendous rise in coin value for the day, as the bulls have been dominating the price charts. Green candlesticks are marking a strong bullish trend as the cryptocurrency value climbed to a $3.89 high. On the other hand, the hourly price prediction is in favor of the bears as a price drop was detected in the past four hours.
Disclaimer. The information provided is not trading advice. Cryptopolitan.com holds no liability for any investments made based on the information provided on this page. We strongly recommend independent research and/or consultation with a qualified professional before making any investment decisions.