- Litecoin could start fresh increase if buying pressure increases above immediate resistance
- Against USD, Litecoin is following a lower low and lower high pattern on the 4-hours chart
- A break below 0.00585 BTC support may cause serious bearish action for the LTC/BTC pair, but a triple bottom pattern is much likely to play out.
LTC/USD: Litecoin Bounces Back After Testing Support
Key Resistance Levels: $43.7, $47
Key Support Levels: $37.9, 34.5, $32.4
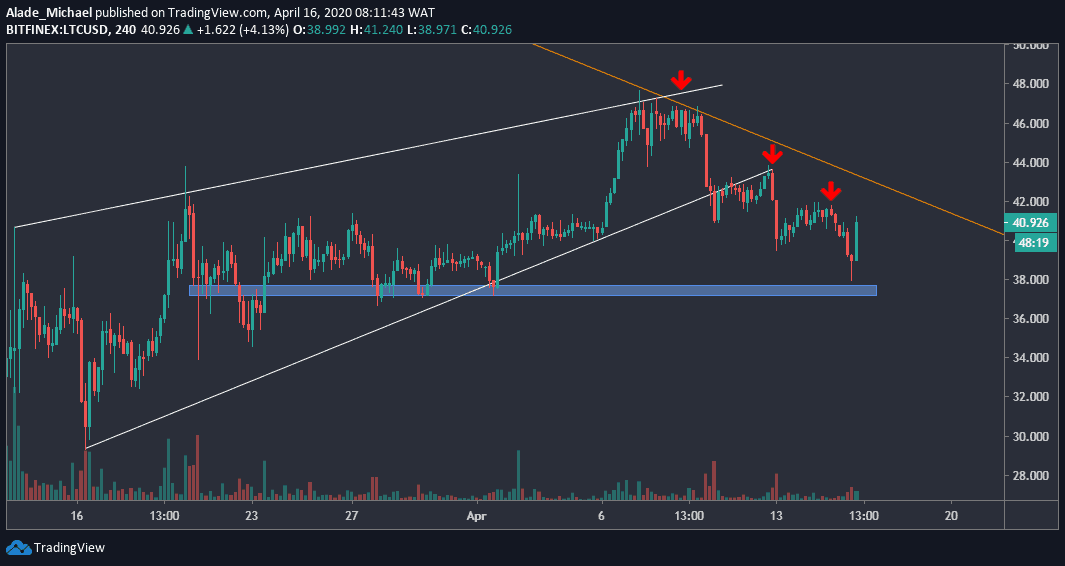
Litecoin continued to show a sign of weakness after breaking down from an ascending wedge on April 12. After dropping to $37.9 today, LTC bounced and quickly recovered back above $40 level, the support that got broken a few hours ago.
Meanwhile, the last 24-hours decrease is caused by a 5% drop in Bitcoin’s price to $6500 today; suggesting that bearish action is still dominant. Another bearish sign here is the lower low and lower high pattern that is forming since the price broke down from an ascending wedge – as can be seen on the 4-hours chart.
At the moment, LTC is trading around $41 against the US Dollar. A climb above the previous resistance levels – the red arrow points could allow bulls to regain control. But looking at the current price setups, the bears are still in play.
Litecoin Price Analysis
As stated above, Litecoin is recovering back towards previous resistance at $42. An increase above this initial resistance could trigger intense buying to $43.7 and $47 – where the drop started last week.
Towards the downside, Litecoin is now holding support level at $37.9 – the current daily low. If Litecoin drops below the blue demand area, the closest support to watch out for is $34.5 (March 17 low).
The next support after this is located at $32.5. It may even dip to $30 if the selling volume keeps increasing.
LTC/BTC: Litecoin Forming Triple Bottom
Key Resistance Levels: 0.006375 BTC, 0.0068 BTC
Key Support Levels: 0.00585 BTC, 0.0055 BTC
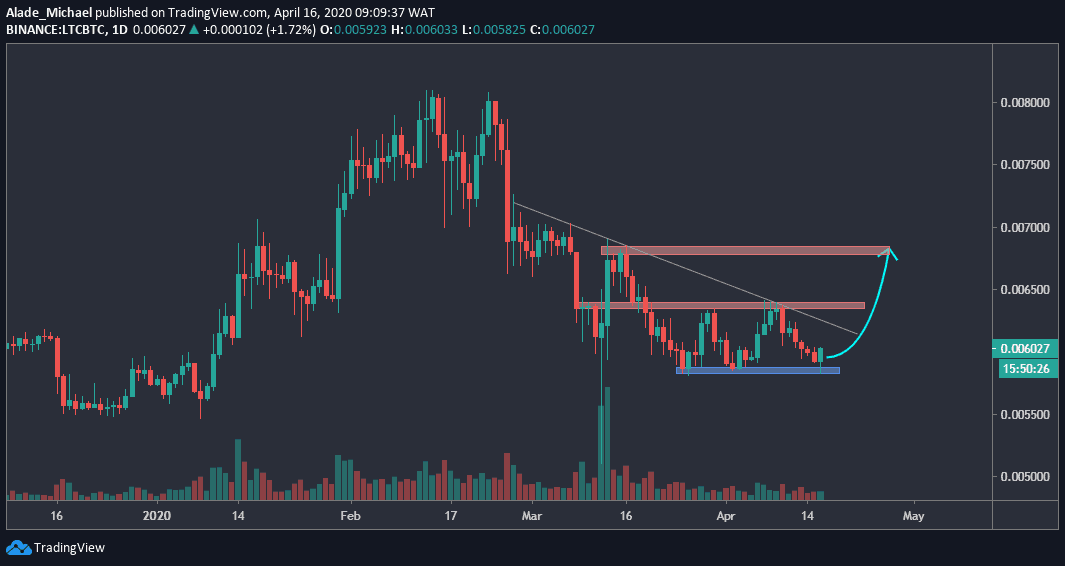
Against Bitcoin, LTC is currently down by 1.31% after witnessing a consistent 9-day decline from 0.006375 resistance; which has proved difficult for the bulls to overcome for the past three weeks now.
At the same time, the grey descending trend line has been suppressing bullish actions since February. As can be seen on the daily chart, Litecoin just bounced slightly from a significant support level at 0.00585 BTC; which held bearish actions for the past three weeks now.
The latest bounce could validate a triple bottom pattern for Litecoin if buyers can take advantage of the current price actions. However, the scenario might become uglier if the price plunges below this significant support.
Litecoin Price Analysis
If Litecoin loses 0.00585 BTC support (the blue area on the chart), huge selling pressure may slip the price at 0.0055 BTC. It may even reach 0.005 BTC if selling volume is increased.
On the other hand, the latest increase in Litecoin’s price is providing buyers with a big opportunity – a triple bottom formation. A successful climb above the grey trend line should confirm a buy to 0.006375 BTC resistance, followed by 0.0068 BTC, mark red on the daily chart.
The next bullish projection would be at 0.0080 BTC if Litecoin breaks above these mentioned resistances.