- Shiba Inu price analysis is bearish today.
- Strong resistance at $0.00003324.
- Trading price of SHIB is $0.00002056.
Today’s Shiba Inu price analysis reveals a bearish movement in the market. Furthermore, the bears have found new strength in the resistance that they have used to clench the market tighter. The odds seem to fall out of the bulls’ favor. However, the bears currently control the market, but can they maintain it? As a result, the price of SHIB experienced massive depreciation and reached $0.00002107, from $0.00002220; on January 30, 2022, SHIB/USD continued a declining trend the following day.
Today, on January 31, 2022, the price has been experiencing colossal downs, causing the price of SHIB to decrease immensely. As a result, SHIB/USD price has dropped to $0.00002056 while losing a large chunk of its losses over the last few days. SHIB currently trades at $0.00002056. Shiba Inu has been down 6.30% over the previous 24 hours, with a trading volume of $528,191,065, ranking #15 with a live market capital of $11,310,133,749/
SHIB/USD 4-hour analysis: Latest developments
The Shiba Inu price analysis has revealed the market following a bearish trend as the market enters a squeeze, forcing the resistance and the support to come closer, making the cryptocurrency’s price significantly less vulnerable to volatile change on either extreme. Consequently, the upper limit of the Bollinger’s band is present at $0.00002217, which acts as the strongest resistance for SHIB. Conversely, the lower limit of the Bollinger’s band is available at $0.00002037, which acts as the strongest support for SHIB.
The SHIB/USD price appears to be crossing under the Moving Average curve, making the market bearish. The price has entered the bearish zone again, with little room for a reversal or a consistent trend. The price seems to be following a downwards movement indicating a possible break in the support, leading to a breakout in the market.
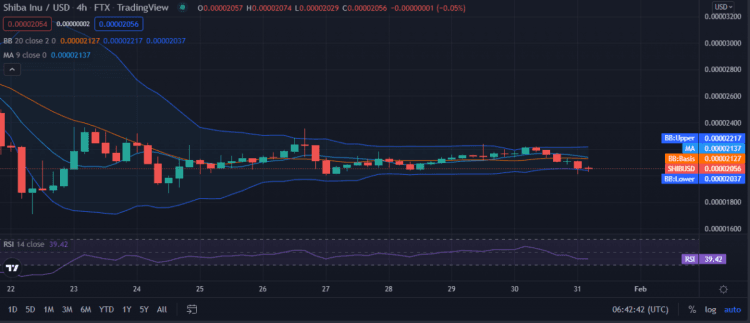
The Shiba Inu price analysis reveals that the Relative Strength Index (RSI) score is 39, making SHIB/USD fall in the lower neutral region. However, the price follows a linear trend indicating stability and equivalence of the buying and selling activity.
Shiba Inu price analysis for 1-day: Market expands
The Shiba Inu price analysis has revealed a bearish market. Moreover, the market’s volatility appears to follow an increasing trend, making Shiba Inu’s price more vulnerable to volatility fluctuations. As a result, the upper limit of the Bollinger’s band is present at $0.00003324, which serves as the most substantial resistance for SHIB. Conversely, the lower limit of the Bollinger’s band exists at $0.00001660, which acts as the strongest support for SHIB.
The SHIB/USD price appears to cross under the curve of the Moving Average, signifying a bearish movement. On the other hand, the price seems to be following a downwards activity towards the support. If the price manages to break the support, it will be a significant step towards a reversal movement in the market.
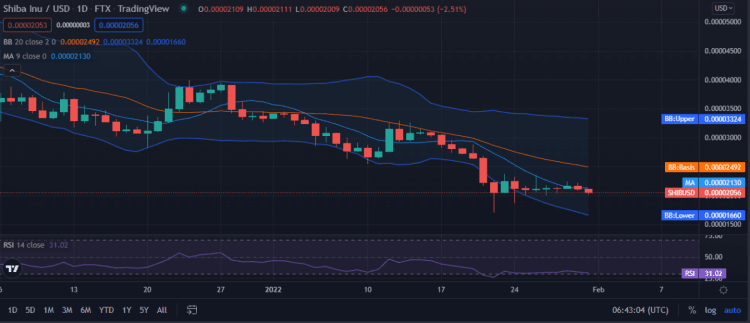
The Shiba Inu price analysis reveals the Relative Strength Index (RSI) score to be 31, signifying an undervalued cryptocurrency. Furthermore, the RSI falls in the depreciation region. Therefore, following a slight downwards approach is signaling towards devaluation and representing the selling activity exceeding the buying activity, causing the RSI score to decrease.
Shiba Inu Price Analysis Conclusion:
The Shiba Inu price analysis concludes that the cryptocurrency follows a bearish trend. However, Shiba Inu has shown promising dynamics for a reverse movement, but that will depend on the performance of the bulls. Furthermore, the support is expected to break in a few hours, potentially leading to a breakout, reversing the market dynamic.
Disclaimer. The information provided is not trading advice. Cryptopolitan.com holds no liability for any investments made based on the information provided on this page. We strongly recommend independent research and/or consultation with a qualified professional before making any investment decisions.