- Price has dropped down to $69.58.
- Avalanche price analysis shows downtrend.
- Support is available at $53.44.
The latest Avalanche price analysis shows signs of a downward trend for the day, as the cryptocurrency faced loss in the last 24-hours. Although the bulls took over the market in the last two weeks, today, the bears overcame bullish pressure. The price levels have moved down to $69.58 because of the latest bearish strike. Further downfall in coin value is to be expected if the sellers remain persistent.
AVAX/USD 1-day price chart: Cryptocurrency value steps down to $69.58 after downturn
The one-day Avalanche price analysis confirms a negative trend for the cryptocurrency, as the bears remained dominant during the day. Although the bullish curve was progressing swiftly in the earlier days, today’s trend is going relatively in favor of the bears. The price has been reduced to $69.58 because of the ongoing decreasing trend. If we discuss the moving average (MA) value in the one-day price chart, it is standing at the $66.11 level.
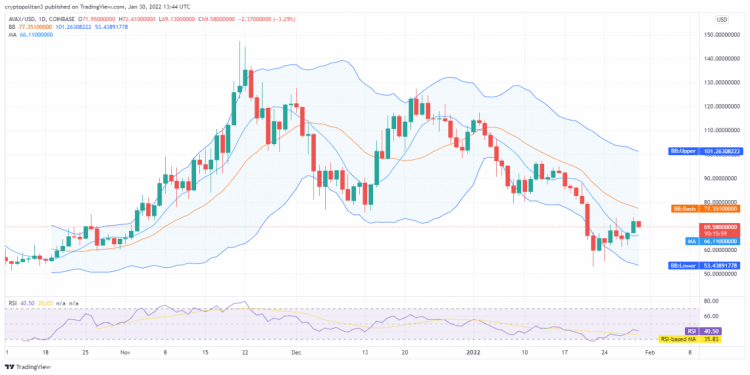
The short-term trending line is still moving ascendingly as the bulls were leading the market in the prior weeks. If we discuss the Bollinger bands Indicator’s values, its upper edge is present at $101.26, and its lower edge is touching $53.44. The Relative Strength Index (RSI) score is now 40.50, near the neutral zone.
Avalanche price analysis: Bearish slide relocates price to $69.53 low
The four-hour Avalanche price analysis confirms a declining trend as the bears have been ruling the price chart for the past few hours. A consistent drop in AVAX/USD value was recorded for the previous hours, and the price dropped down up to $69.53 in the last four hours. The bearish wave is to continue in the approaching period as well as the selling activity is on the rise. The price is now standing lower than its moving average value, i.e., $70.86.
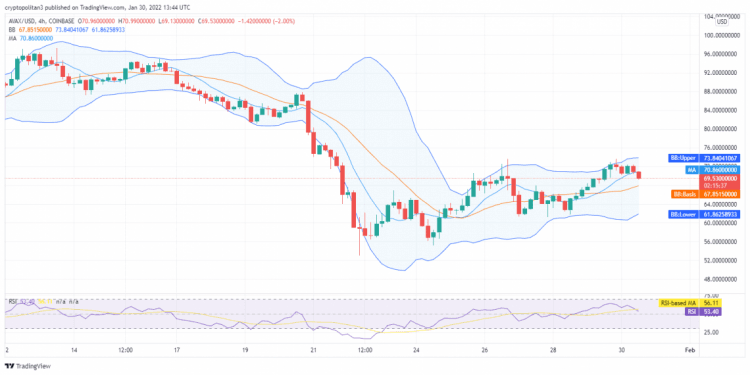
The SMA 20 curve is still moving at a greater height than the SMA 50 curve as the bulls were ahead of the bears in the earlier part of the day. Currently, the upper Bollinger band shows a value of $73.84, whereas the lower Bollinger band displays $61.86. The RSI graph shows a downward curve as the score lowered to 53.40.
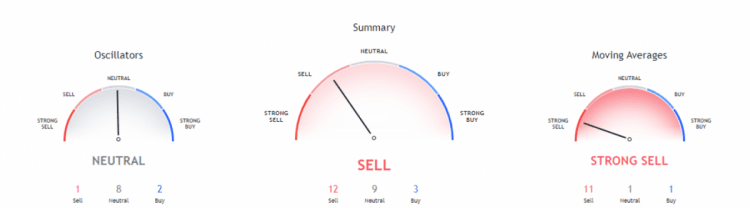
The general overview of the market trends for AVAX/USD shows that the bears have been in the upper position for the most part. The technical indicators chart further indicates this as it is giving out a bearish signal. There are 12 indicators present on the selling point; nine are neutral, while only three are on the buying point.
The Moving Averages Indicator predicts a downward trend by giving out a selling signal as well. We can see that 11 indicators are occupying the selling position, while one indicator each is present on both the neutral and buying positions. The Oscillators are giving a neutral hint for the day as eight indicators are on the neutral side, two are on the buying side, and only one is on the selling side.
Avalanche price analysis conclusion
The above one-day and four-hour Avalanche price prediction favors the sellers, as a considerable decline in coin value was observed during the day. A red candlestick indicated a drop in AVAX/USD value, which was lowered to $69.58. The hourly price analysis shows similar price trends, as a bearish wave is seemingly taking over the market.
Disclaimer. The information provided is not trading advice. Cryptopolitan.com holds no liability for any investments made based on the information provided on this page. We strongly recommend independent research and/or consultation with a qualified professional before making any investment decisions.