- Dogecoin price analysis is bearish today.
- DOGE/USD is currently trading at $ 0.1411.
- Technicals are bearish.
Dogecoin price analysis shows that the currency is currently in mixed reaction, trading at $0.14 as of writing this analysis. The currency fell lower from yesterday by roughly 3%. With a lot of volatility to its name, it has been quite a while since we have seen a drastic change in prices.
This currency saw a lower high set at $0.14, and the fact that it was not able to hold on to this level implies a lack of demand at higher levels despite significant buying pressure.
The currency fell below the 50 day EMA and is now trading around $0.14 after having seen a peak at $0.15, so we can expect further depreciation in the short term as well.
Dogecoin price movement in the last 24 hours: Bearish momentum builds up
The last few candles are quite long, which indicates that there is very slow buying interest at the moment. With low volatility levels expected to continue for some time now, we might see the currency test this level again.
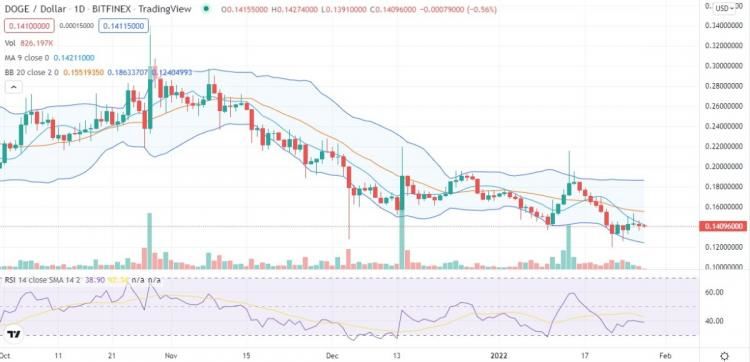
The most logical thing to do here is to watch out for significant buy signals around that level because if it can be broken to the downside, the DOGE/USD pair will drop further to $0.125, which was a previous support zone. If it can’t be broken, we might see a slow and steady rise until it tests $0.14 again.
Is this a good time to buy Dogecoin? Well, the price is currently sitting at $0.14, and since we’ve established that it might go higher from here, there isn’t much reason not to buy right now. With high volatility expected to continue for some time now, there is a possibility that we might see significant price swings over the next 24 hours.
DOGE/USD 4-hour chart: Any chances of a bullish reversal?
DOGE/USD pair is about to retest a previous resistance level ($0.14), so there are chances that it will break higher soon. If it manages to break this level, we might see a breakout towards $0.15, acting as resistance previously. There aren’t too many signs to suggest a breakout just yet, but it is likely to be in the next few days.
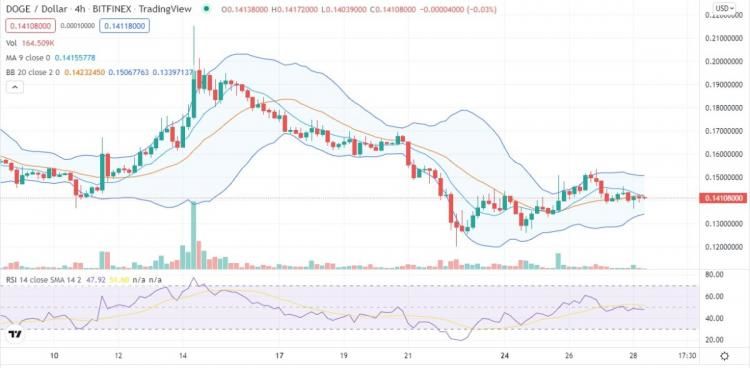
The 100 EMA line trading at 0.13992964 indicates a downtrend, although it isn’t as strong as before. The MACD is presently in the bearish zone but hasn’t managed to turn bearish just yet.
The Eliot Wave indicator shows a possibility of a correction from the bearish slope. This could end up turning into a very slow and steady rise over the next week or so.
Looking at the Dogecoin price analysis, it is evident that the DOGE/USD pair might test $0.14 again over the next 24 hours, so buying around these levels would be recommended. Bearish momentum isn’t too strong right now, even though volatility remains low.
Dogecoin Price Analysis: Conclusion
Dogecoin price analysis shows that the currency is currently bearish, trading at $0.14 as of writing this article. The currency fell lower from yesterday by roughly 3%. With a lot of volatility, it has been quite a while since we have seen a drastic change in prices.
Disclaimer. The information provided is not trading advice. Cryptopolitan.com holds no liability for any investments made based on the information provided on this page. We strongly recommend independent research and/or consultation with a qualified professional before making any investment decisions.