- AAVE/USD value is now settled at $147.54.
- AAVE price analysis predicts uptrend.
- Support is stable at $129.61 mark.
The latest AAVE price analysis is giving the lead to the buyers, as the bullish momentum has gained stability in the last 24-hours. The price is on its way towards revival and has been recovered up to the $147.54 mark during the day. For the past few weeks, the overall market trends have been in bearish support, but currently, the circumstances are seemingly transforming. Further recovery is possible if the buyers remain persistent with their efforts.
AAVE/USD 1-day price chart: Cryptocurrency value finds recovery above $147.5
The one-day AAVE price analysis shows signs of a slight recovery in coin value, as the price curve took an upturn in the last 24-hours. This is being confirmed by the improvement in price, as it is now standing at $147.54 high. In the prior weeks, the bears remained at the leading position, but today, the buyers changed a bit. The price is still quite low if we compare it to its moving average (MA) value of $164.89.
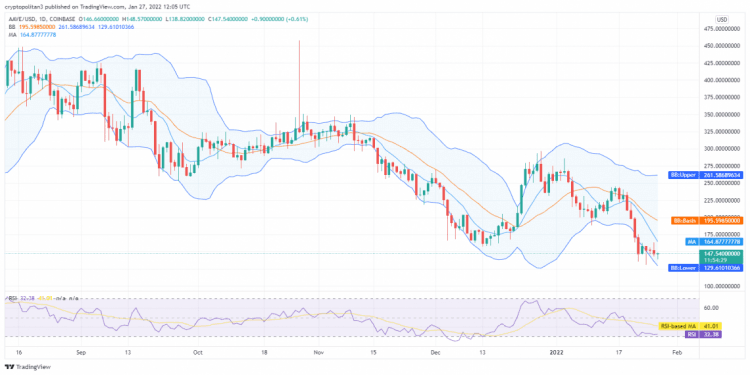
The Bollinger bands are diverging, which means that the volatility is increasing, and the price might experience a fall in the next few days. The upper Bollinger band is now at the $261.59 level, and the lower Bollinger band is at $129.610. The Relative Strength Index (RSI) graph shows a downward slope, and the score has receded to 32.4 because of previous trends.
AAVE price analysis: Bullish strike launches price above $147 hurdle
The four-hour AAVE price analysis shows an increasing trend taking over the cryptomarket. The price is going high for AAVE/USD, as it rose to $147.70 high in the preceding hours. The last four hours yet again proved favorable for the cryptocurrency buyers, and the green candlesticks are noticeably dominating the price chart. If we move towards the moving average indicator, it shows $149.79.
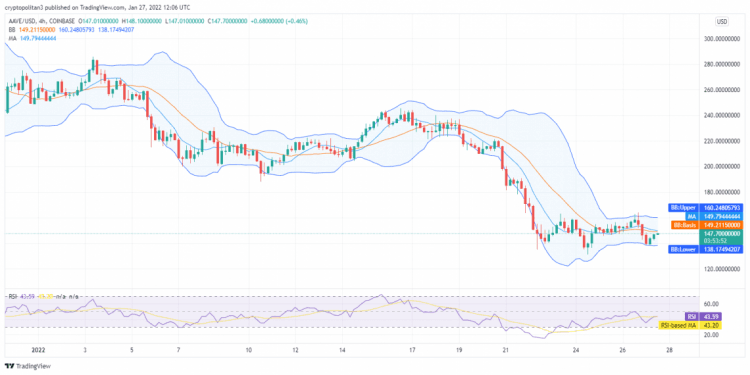
A crossover between SMA 50 curve and the SMA 20 curve was expected, which is likely to get delayed as the bulls have made a comeback. The Bollinger bands Indicator shows us the following values; the upper extreme is standing at $160.25, whereas the lower extreme is at $138.17. The RSI curve has ascended to 43.59 point and is expected to cross the neutral zone soon.
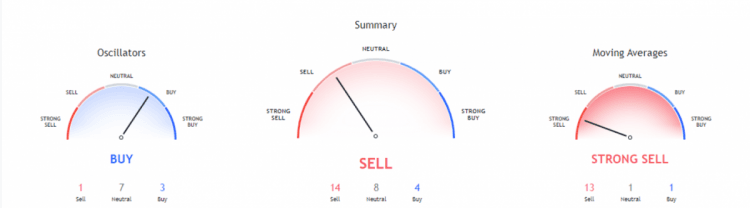
As observed over the past few weeks, the overall market trend has repeatedly been going in favor of the sellers. The bearish momentum gained strength in that period, further confirmed by the bearish signal. The indicators ratio is as such that 14 indicators are on the selling side, eight are neutral, and only four are on the buying side.
The Moving Averages Indicator gives out a strong bearish signal for AAVE/USD. 13 indicators occupy the selling position, while one indicator each sits on the neutral and buying positions. The Oscillators are predicting the current trends to be bullish, and seven indicators are on the neutral point; three are on the buying while only one indicator is on the selling point.
AAVE price analysis conclusion
The one-day and four-hour AAVE price analysis shows a rising possibility of an upturn in price. The bullish momentum gained stability in the past 24-hours, as the price stepped up to $147.54. Further improvement is to follow if the buyers show consistency with their efforts. The hourly price chart shows an increasing number of green candlesticks, a further indication of an upward trend.
Disclaimer. The information provided is not trading advice. Cryptopolitan.com holds no liability for any investments made based on the information provided on this page. We strongly recommend independent research and/or consultation with a qualified professional before making any investment decisions.