Cosmos (ATOM) has increased by 13% today and could soon make its third breakout attempt above the $44.5 horizontal resistance area.
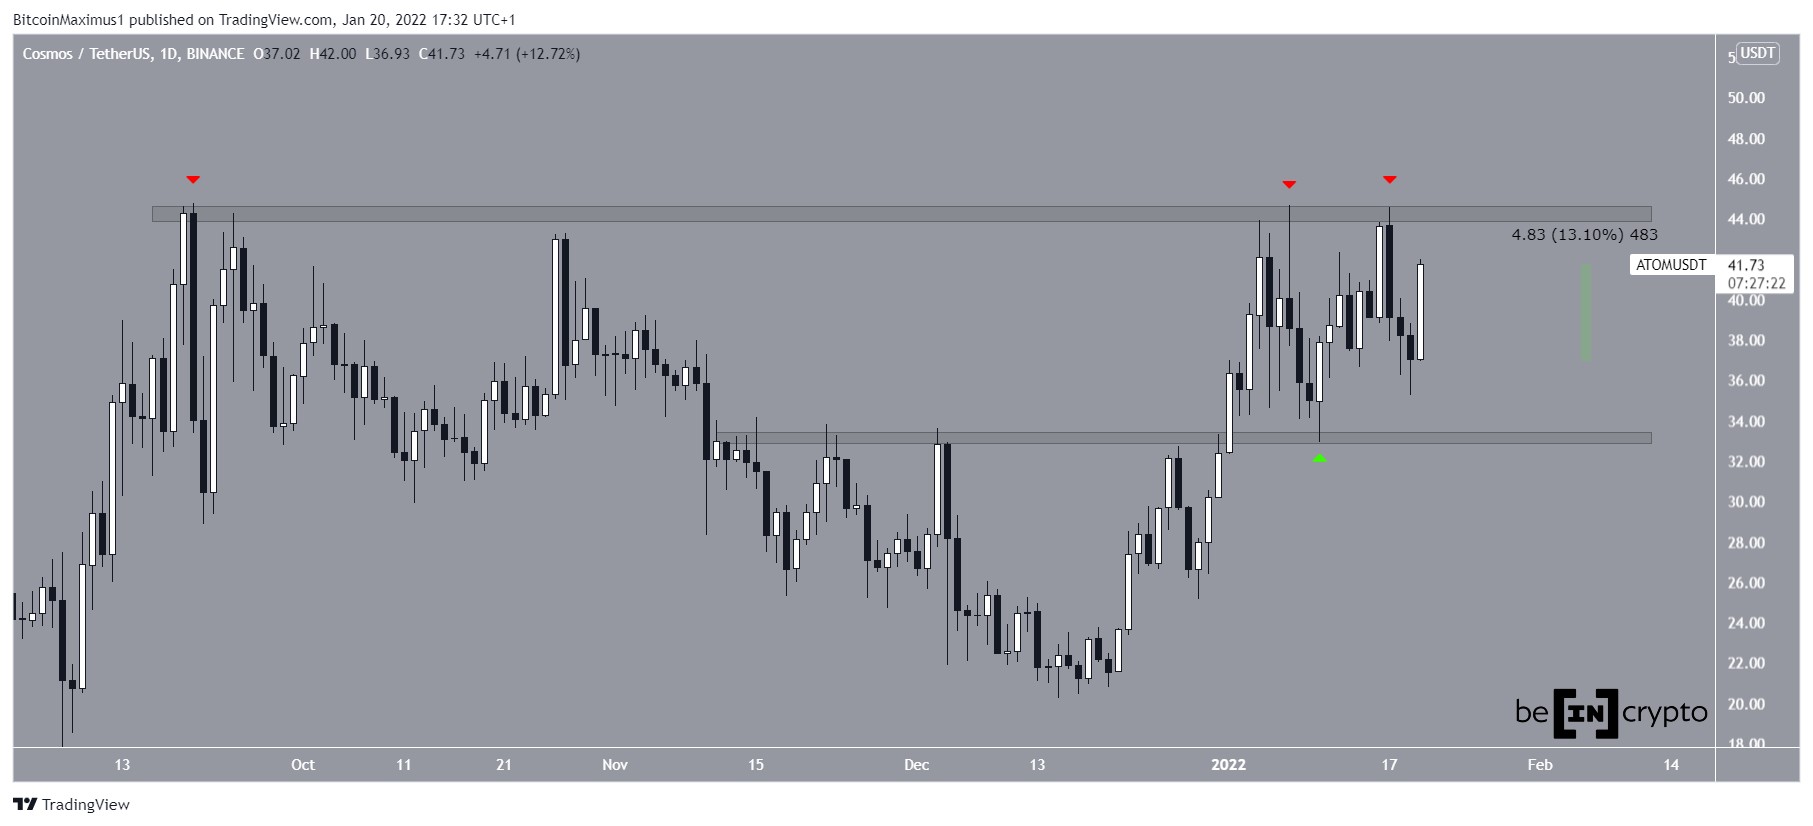
On Sept 20, ATOM reached a new all-time high price of $44.8 (red icon), and then began a long corrective period, while led to a low of $20.18 on Dec 15. It has been increasing since.
On Jan 7 and 17, it made two breakout attempts (red icons) above the $44.50 area. However, it was unsuccessful in both.
Between then, it bounced at the $33.3 area, validating it as support (green icon). It has been increasing since and is approaching the $44.5 area once more, likely making another breakout attempt.
Cryptocurrency trader @George1Trader tweeted an ATOM chart, stating that the token is likely to move towards the range high at $44.5
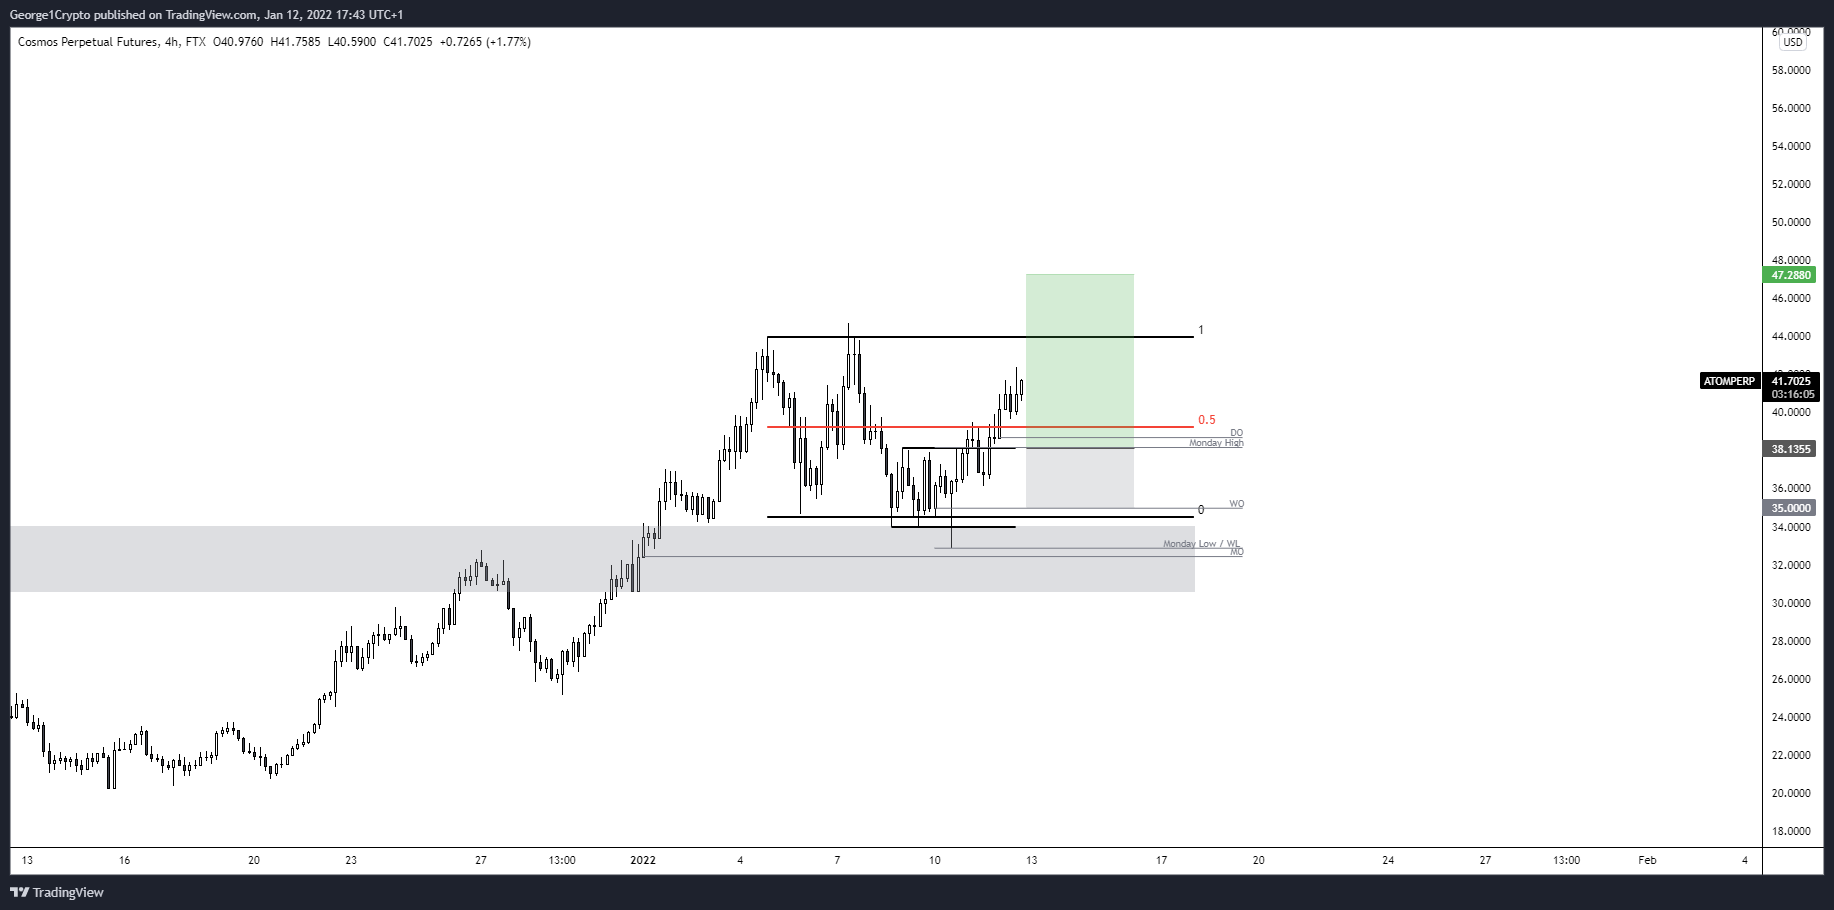
Since the tweet, ATOM has increased and is currently making an attempt at breaking out.
Will ATOM reach a new all-time high?
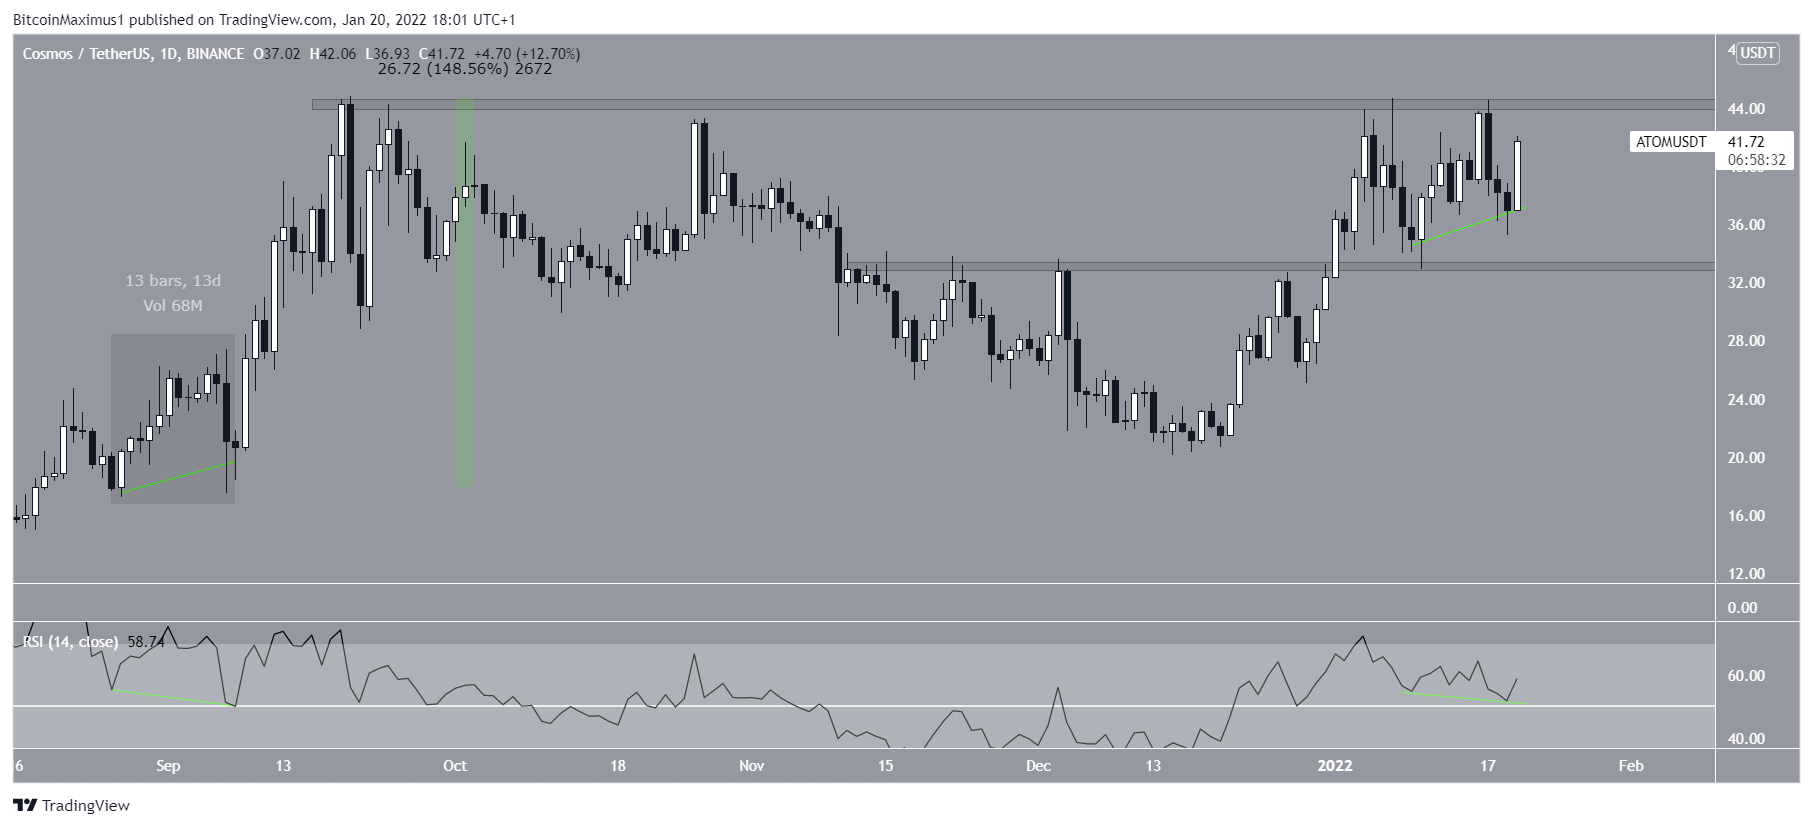
Technical indicators in the daily time-frame support the continuation of the upward movement towards a new all-time high price. This is especially visible by the hidden bullish divergence (green line) in the RSI, which is a very strong sign of trend continuation.
The previous time such a divergence developed (highlighted), an upward movement with a magnitude of 150% followed, leading to the current ATOM all-time high price.
The RSI is also above 50, a reading which is associated with bullish trends.
Therefore, according to this indicator, a new all-time high price is likely.
Future movement
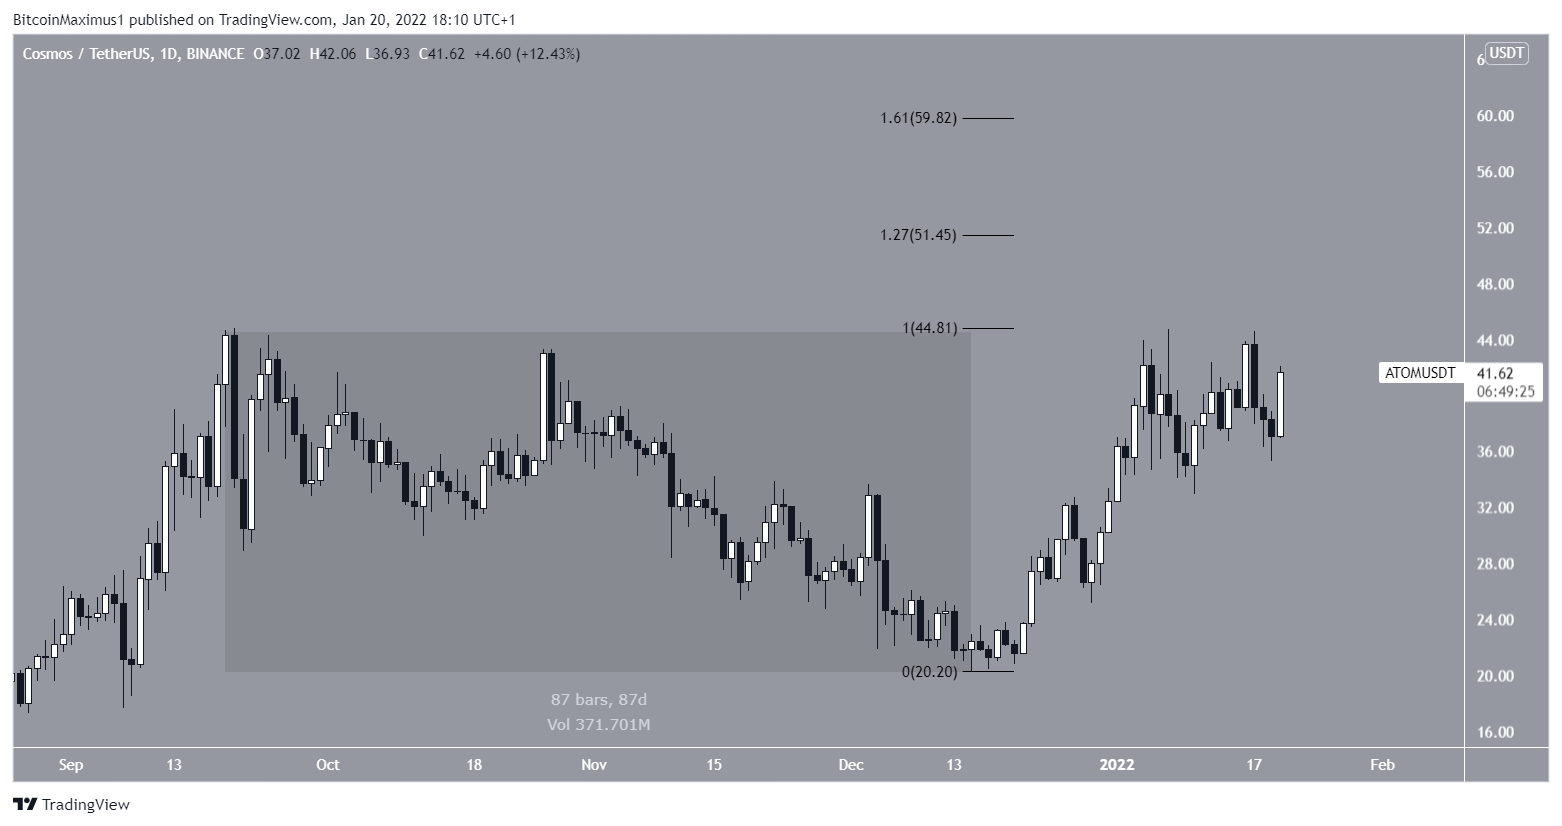
Since ATOM is very close to a new all-time high price, the use of an external Fib retracement is required in order to determine the next closest resistance levels.
When using one of the most recent decrease (highlighted), the closest resistance levels are found at $51.45 and $59.80. These are the 1.27 and 1.61 external Fib retracement resistance levels, respectively.