FTT coin price action shows a bullish rally approaching the $50 mark after the wedge pattern breakout. Will it surpass selling pressure at $50? FTT is the cryptocurrency token used by the platform used for trading in cryptocurrency derivatives, FTX. FTX is operated by Almeda Research, which is recognized as among the top reliable companies in crypto trading, as well as one of the biggest liquidity providers. Sam Bankman-Fried is co-founder chief executive officer and co-founder of The FTX Cryptocurrency Derivatives Exchange. He is also Chief Executive Officer at Almeda Research and worked as director of development at the Center for Effective Altruism. Let us move ahead to read about FTX Token technical analysis.
Past Performance of FTT
FTT coin price action manages to continue the bull run after the bullish breakout of the falling wedge pattern in the daily chart. Moreover, the rally surpasses the horizontal level at $44 and retests to regain the bullish momentum. The coin price has increased by more than 20% past its breakout point, mentioned in our previous article. Currently, the uptrend approaches the psychological resistance at $50. 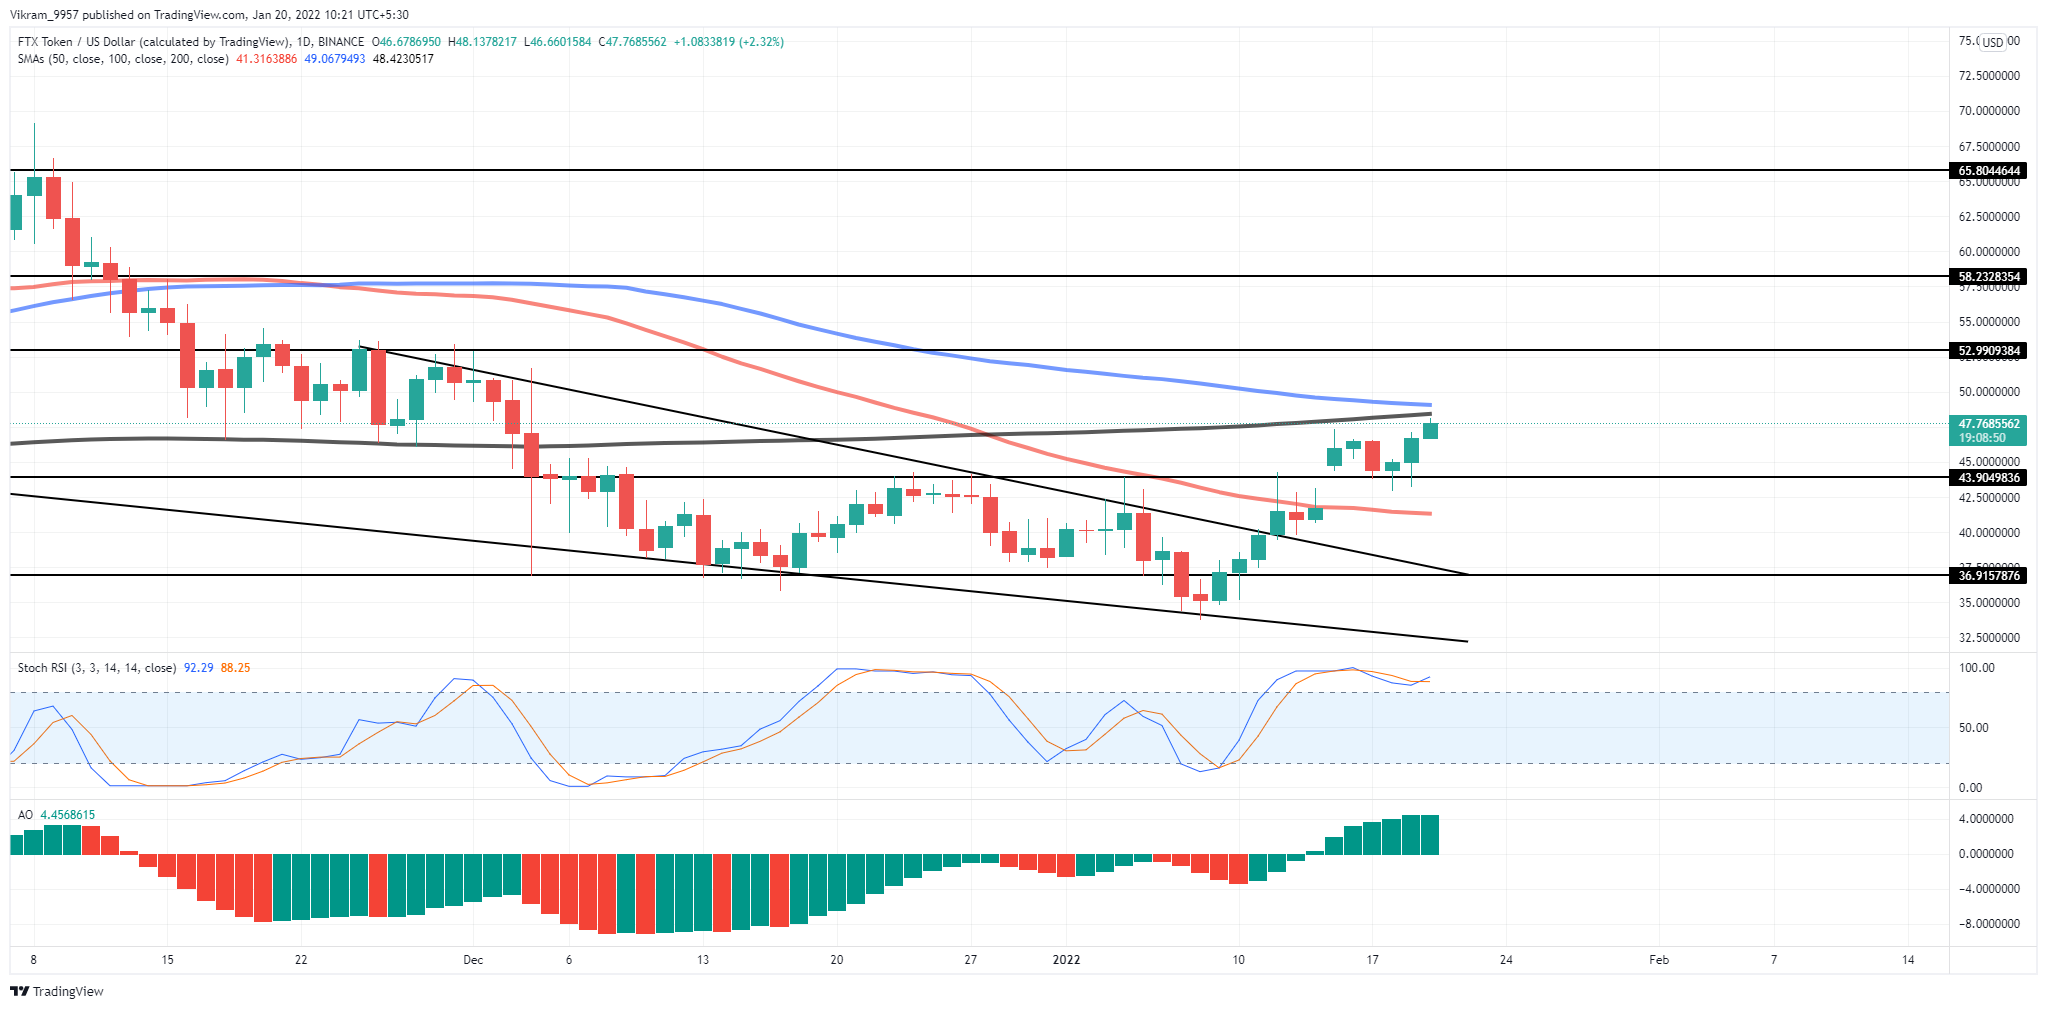 FTT/USD Daily Chart
FTT Technical Analysis
The recent jump of almost 10% from the $44 support level in the FTT coin price brings it closer to the psychological resistance of $50. However, the increased trend momentum after the retest and evident lower price rejection in the price action indicates a high possibility of a breakout. The sudden jump in the FTX token price brings it closer to the 200-day SMA and attempts to avoid the bearish crossover with the 100-day SMA. Moreover, the 50-day SMA. The Awesome Oscillator indicator reflects a bullish histogram in action above the zero line in the daily chart. Thus, indicating that the bullish forces are in control of the market trend. The Stochastic RSI indicator shows a bullish crossover of the K and D line in the overbought zone in the daily chart. The lines overcome the selling pressure and neutralize the previous bearish crossover. From a technical perspective, the FTX token can shortly breakout above the $50 mark and reach the next resistance level.
Upcoming Trend
The FTT coin price shows a solid bullish rally supported by the increased trend momentum and buying pressure. Therefore, traders can find buying opportunities at current prices with a target of $58. The coin price chart suggests the next resistance levels at $53 and $58 after the 200-day SMA. And, the support levels are at $44 and the 50-day SMA. At press time, the technical analysis by TradingView gives a "BUY" signal for the FTT coin.