- The Monero price analysis is bullish.
- Resistance for XMR/USD is present at $214.
- Support for XMR is present at $199.
The Monero price analysis shows bullish traits as the price has increased today. The past few days proved detrimental for XMR as a strong bearish trend was going on, and the coin suffered an immense loss. The support has appeared just above the $200 psychological mark as bulls have made a comeback, and the price levels have been seen going up today. But the market pressure seems to be quite strong at this level as the price is in a resistance zone, and the selling pressure has appeared again.
XMR/USD 1-day price chart: Bullish momentum strengthens as the price continues upside
The 1-day Monero price analysis shows the price is trading on the green side after the bulls elevated the price level. The XMR is currently trading hands at $208.6 at the time of writing. The crypto pair reports an increase in price value of 3.1 percent over the last 24 hours and a 6.21 percent gain in price value over the last seven days. However, the trading volume has decreased by 14.9 percent, but on the other hand, the market cap has increased by 3.29 percent.
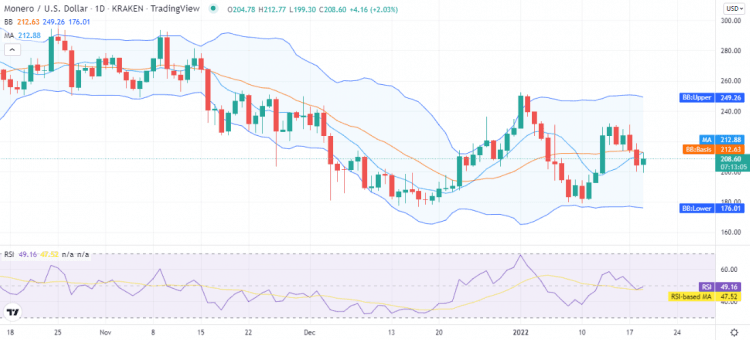
The volatility is almost constantly high for XMR/USD, with the upper Bollinger band at the $249 mark representing resistance and the lower band is at the $176 mark; the coin’s price is trading below the mean average line of the indicator, which is present at the $212 mark.
The relative strength index is hovering near the center of the neutral zone, the RSI is on an upwards curve, indicating increasing buying activity, but now its upwards movement has slowed down.
Monero price analysis: Recent developments and further technical indications
The 4-hour price chart for Monero price analysis shows the bears are giving tough competition as they have devalued the price significantly during the last few hours and are still ruling the price function if observed over an hourly basis as the last two candlesticks are red, indicating the bearish price function for the last eight hours.
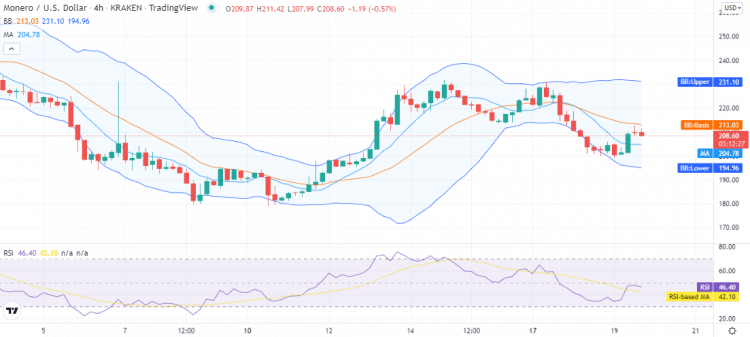
The volatility has increased as the Bollinger bands are diverging, providing a bigger envelope for the price function to move around. The upper band is at the $231 mark, and the lower band is at the $194 mark. The moving average (MA) is trading below the price level at the $204 mark. The RSI has also dipped down to index 46; the slight curve of RSI during the current hours shows the selling activity in the market.
Monero price analysis conclusion
The Monero price analysis shows good prospects for the mid-term traders, as the last week’s price trend line is upwards. But a correction is currently taking place, as is obvious from the price function of the last few hours, but the decrease in price is not steep. We expect XMR/USD to continue further upside today, and the price may improve up to $214 in the next 12 hours.
Disclaimer. The information provided is not trading advice. Cryptopolitan.com holds no liability for any investments made based on the information provided on this page. We strongly recommend independent research and/or consultation with a qualified professional before making any investment decisions.