- FTX Token price analysis is bullish today.
- Strong support is present at $44.9.
- The resistance for FTT is present at $46.5.
The FTX Token price analysis is bullish for today as the coin has gained bullish momentum since morning. The price has recovered to the $46 level as bulls got the lead back after the price broke downwards at the start of today’s trading session. The price function was under pressure as the token’s price level decreased overnight, but late in the morning, the bullish support appeared around the $43.4 support zone.
FTT/USD 1-day price chart: FTT gains six percent value after going through a decline
The 24-hour FTX Token price analysis shows the price has increased today, as the FTT/USD pair is trading hands at $46 at the time of writing. As the bulls are leading the price function, the FTT reports an increase in value by 6.46 percent over the last 24 hours and an increase of 12.29 percent over the past week. The trading volume increased by 25.18 percent, and the market cap has also increased by 6.46 percent, providing a market dominance of 0.32 percent to the FTT.
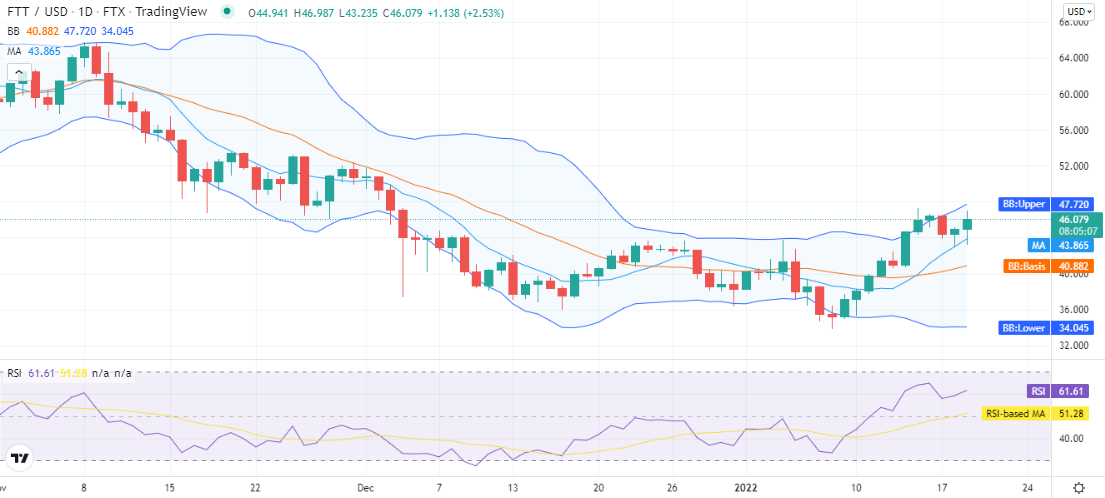
The volatility is increasing by a considerable margin for FTT. The Bollinger bands are expanding, the upper Bollinger band is at the $47.7 mark representing resistance for the token, and the lower band is at the $34 mark representing the strongest support.
As the bullish momentum returned and the buying activity started again, the relative strength index (RSI) also started to improve and has reached index 61, hinting at the overwhelming buying activity.
FTX Token price analysis: Recent developments and further technical indications
The 4-hour price chart for FTX Token price analysis shows the price breakdown was downwards at the start of the trading session and remained downwards for the night. However, the bullish activity has reignited and has been observed going on for the last eight hours, and the price has been uplifted to a great extent.
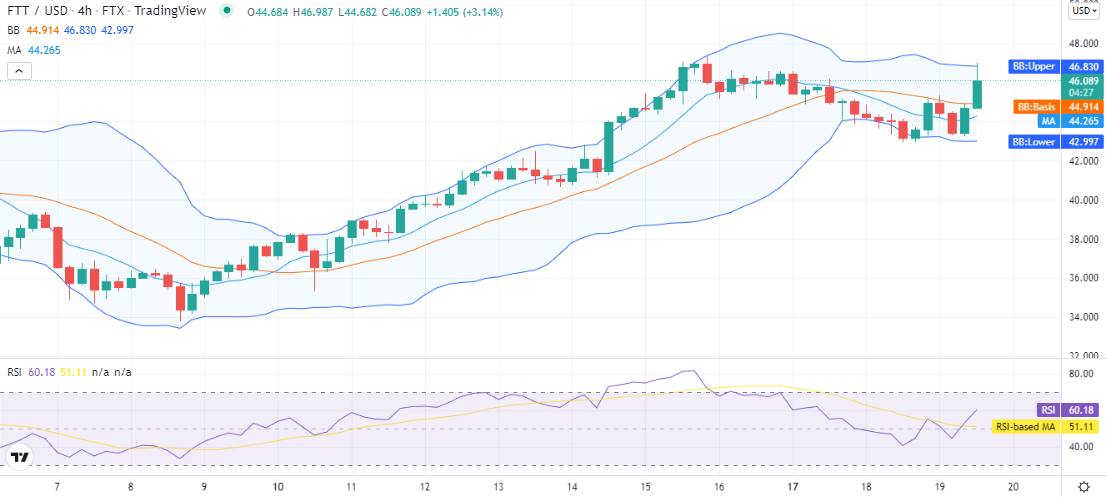
The moving average (MA) is at the $44.2 mark below the price level, complementing the bullish momentum. The volatility is mild as the upper Bollinger band is at the $46 mark, the lower Bollinger band is at the $42 mark, and the Bollinger bands average is at the $44.9 mark, also below the price level. The RSI is trading at a steep upwards curve at index 60, indicating the buying activity in the market.
FTX Token Price Analysis: Conclusion
The FTX Token price analysis suggests a strong bullish trend is going on. The bulls have successfully reversed the bearish trend and have elevated the price level high. Selling pressure is expected as the price is nearing the $46.5 resistance, but we expect the FTT to break above the said resistance in the coming hours.
Disclaimer. The information provided is not trading advice. Cryptopolitan.com holds no liability for any investments made based on the information provided on this page. We strongly recommend independent research and/or consultation with a qualified professional before making any investment decisions.