IOTX coin price action resonates close to the resistance trendline in the daily chart with increased trend momentum. Will the bulls break the trendline? IoTeX can be described as the decentralized platform for machine economics, which supports devices ranging from smart home devices to autonomous cars. In order to achieve this, IoTeX has built and released a speedy, high-performance, and EVM-compliant blockchain that offers flexibility and scalability across diverse applications. Additionally, middlewares and Dapps have built the blockchain platform to enable self-sovereign devices as well as real-world oracles to life. Let us move ahead to read about IoTeX technical analysis.
Past Performance of IOTX
IOTX coin price action shows a downfall of more than 50% in the past two months from its all-time high level near $0.24. The downfall creates a lower-high formation leading to the resistance trendline in action. The generation of descending trendline and the constant support near $0.095 creates a descending triangle pattern in the daily price chart. 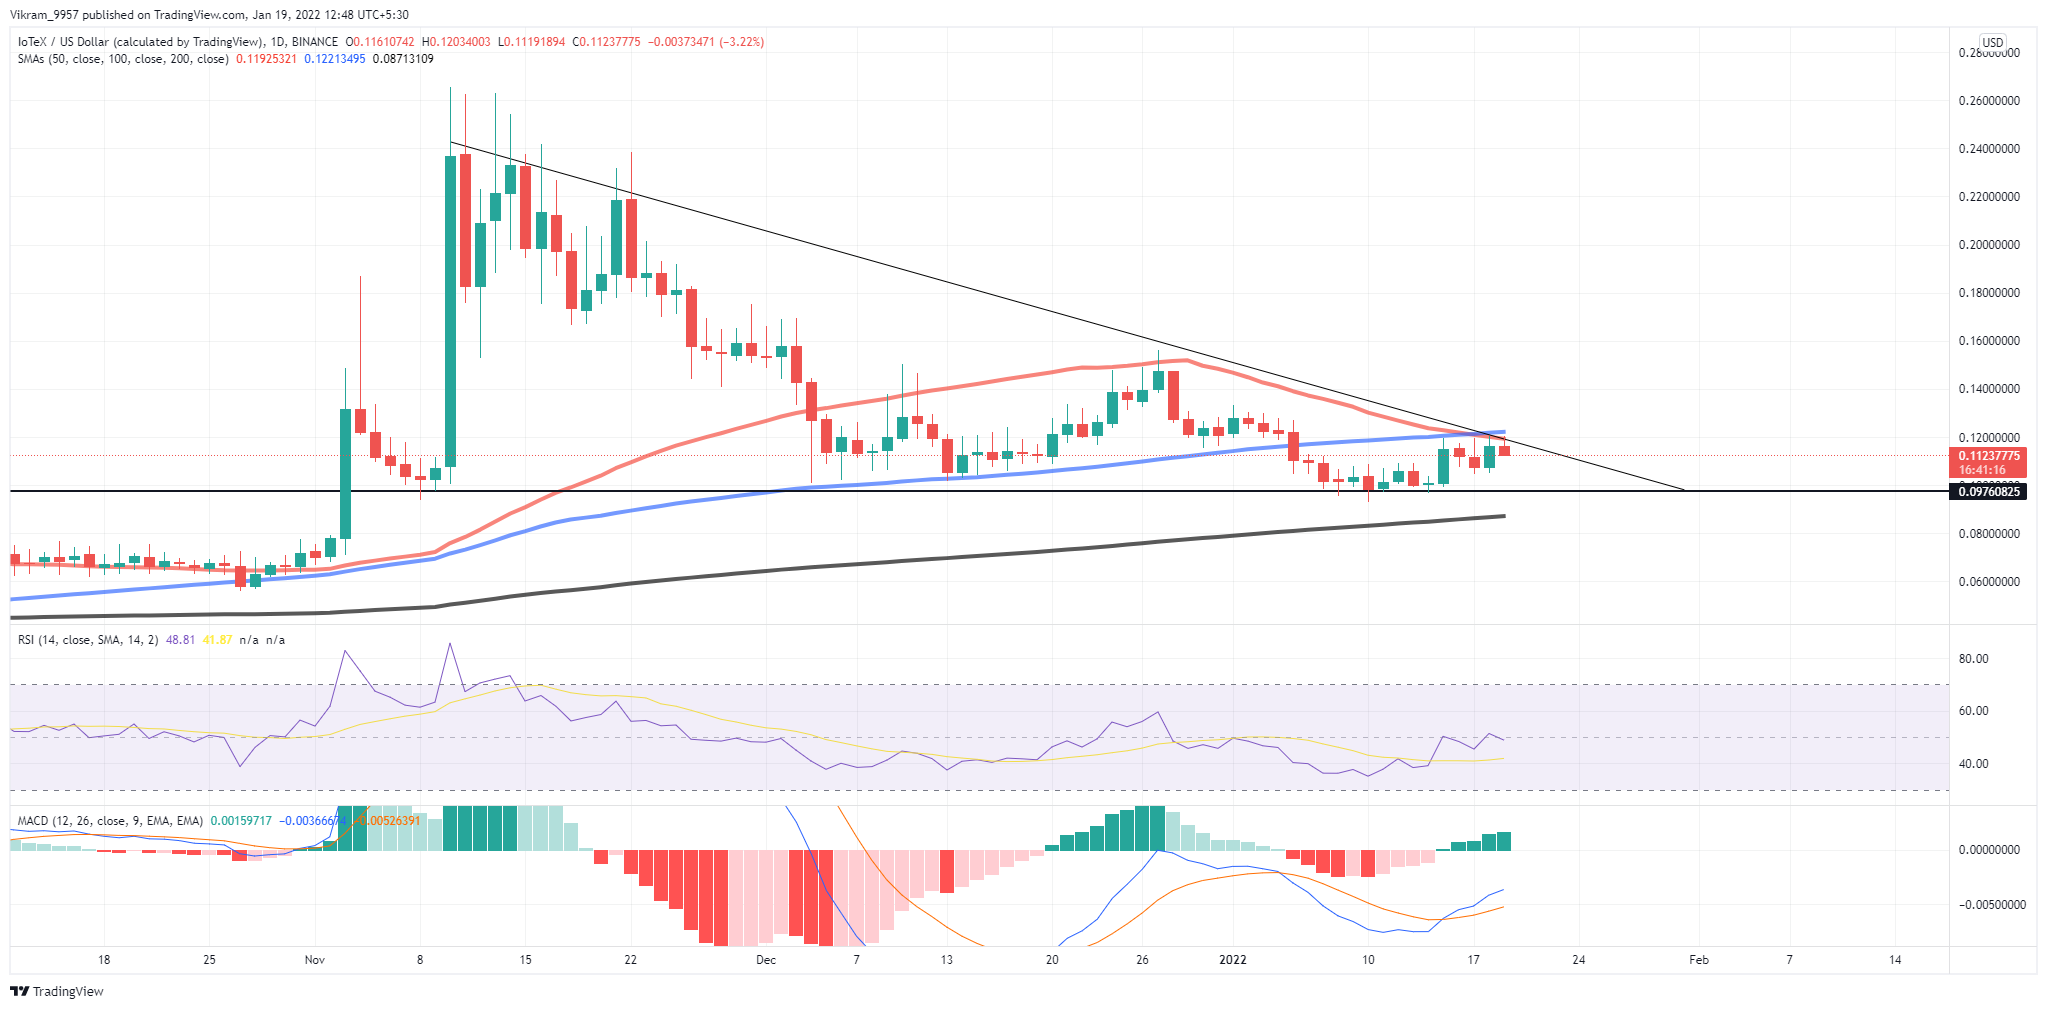 IOTX/USD Daily Chart
IOTX Technical Analysis
The recent jump in the IOTX coin price brings it close to the resistance trendline of the triangle pattern. Moreover, the increased trend momentum and the coiling up of the triangle reflect a high possibility of a bullish breakout. The rally towards the resistance trendline tests the bearish crossover of the 50 and 100-day SMA in the daily chart. Therefore, the bearish attention attempts to make a comeback as the price stabilizes near the support level. The RSI indicator at 50% shows a zigzag movement near the central line in the daily chart as it struggles to rise above it. Moreover, the 14-day SMA shows a gradual bullish reversal in the nearly oversold zone. The MACD indicator shows a bullish crossover in the MACD and signal lines in the daily chart. Furthermore, the increasing trend in bullish histograms showcases a rise in underlying bullish momentum. Thus, from a technical perspective, the IOTX coin price shows a rise in underlying bullishness and increased chances of the breakout of the resistance trendline.
Upcoming Trend
The IOTX coin price resonates close to the resistance trendline of the descending triangle pattern in the daily chart. Therefore, traders can shortly find the bullish breakout entry of the triangle. However, the bearish crossover of 50 and 100-day SMA plans to increase selling pressure and avoid the breakout. Therefore, traders need to be patient with the price to retest the breakout of the triangle pattern. The IOTX coin price chart suggests the next support levels at the 200-day SMA and $0.070 below the triangle pattern. And, in case of a bullish breakout above the resistance trendline, the price can find opposition at $0.15 and $0.18. As the price remains under the triangle, TradingView technical analysis remains "NEUTRAL" for the IOTX coin.