- TRON price analysis is bearish.
- Price has lowered up to $0.068 today.
- Support for TRX/USD is present at $0.067.
The latest Tron price analysis is bearish for today as it is showing signs of a downtrend, as the price has been following a decreasing movement today. Although the cryptocurrency was under the bullish lead in the last week, the trends have shifted today. The bears have been successful in making their comeback on the price chart, as the red candlestick is indicating a loss in price up to $0.067 level. The nearest support for the Tron price function is present at $0.067, and if the downtrend continues, this support might soon be retested again.
TRX/USD 1-day price chart: Bearish resistance results in declining trend for TRX
The 1-day Tron price analysis is confirming a decline in coin value, as the price has been following a bearish trend for the day. The circumstances are turning favorable for the sellers, as the past week observed a constant improvement in the TRX market price. Nonetheless, a downturn in price occurred today, which is why the price has been lowered to $0.067 point. The crypto pair is reporting a loss of 4.30 percent over the last 24 hours, but as the trend was bullish previously, the coin is still showing an increase in price value by 5.8 percent over the past week. The moving average (MA) is still quite low and is present at the $0.067 marker as well.
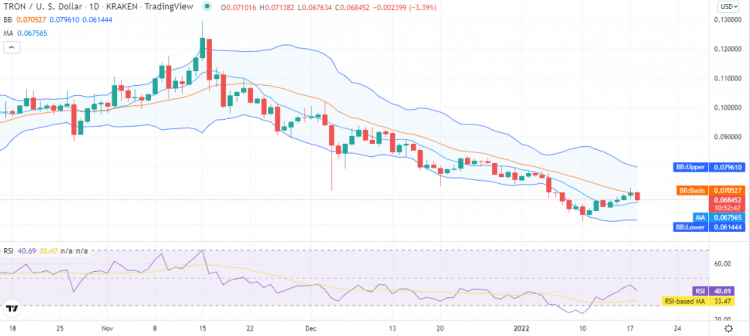
The SMA 50 curve is traveling above the SMA 20 curve as the bearish trend is evidently getting stronger. The increase in volatility has taken the upper Bollinger band value to $0.079 and the lower Bollinger band value to $0.061. The Relative Strength Index (RSI) score has moved down to the index 40 level.
Tron price analysis: Recent developments and further technical analysis
The price is headed down according to the 4-hour Tron price analysis and has reached the $0.068 position. The short-term trending line is also descending as the bears have been showing control over the market for the past few hours. The last four hours have also proved damaging for the cryptocurrency value, as well as the price declined on a noticeable level.
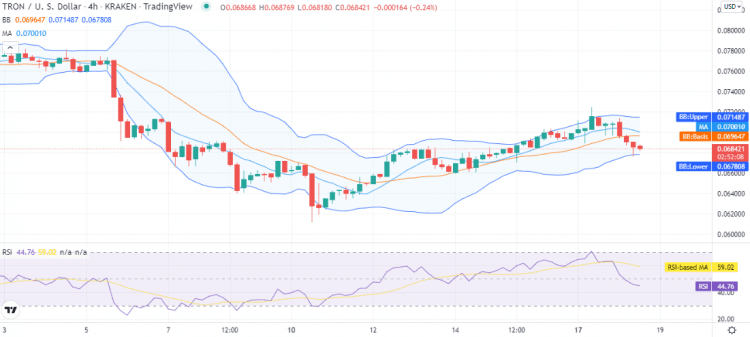
The price has stepped below the moving average value today, i.e., $0.070 on the 4-hour chart. The Bollinger bands indicator is showing an average of $0.069 now. Whereas its upper band has been relocated to $0.071 point, and its lower band is present at $0.067 point representing support for TRX. The strong drop in price has resulted in a decrease in RSI score as well, and currently, the indicator has come down to index 44 due to the strong selling activity.
TRON price analysis conclusion
A decline in price has been observed during the day, which is why the TRX/USD has been devalued to the $0.067 level. Although the bullish momentum was on its way to recovery in the past week, a change in price movements has been recorded. The price might decrease further in the upcoming days, as both the hourly and daily price charts are showing a bearish trend.
Disclaimer. The information provided is not trading advice. Cryptopolitan.com holds no liability for any investments made based on the information provided on this page. We strongly recommend independent research and/or consultation with a qualified professional before making any investment decisions.