BeInCrypto takes a look at the price movement for seven different cryptocurrencies, including Near Protocol (NEAR) which recently hit a new all-time high.
BTC
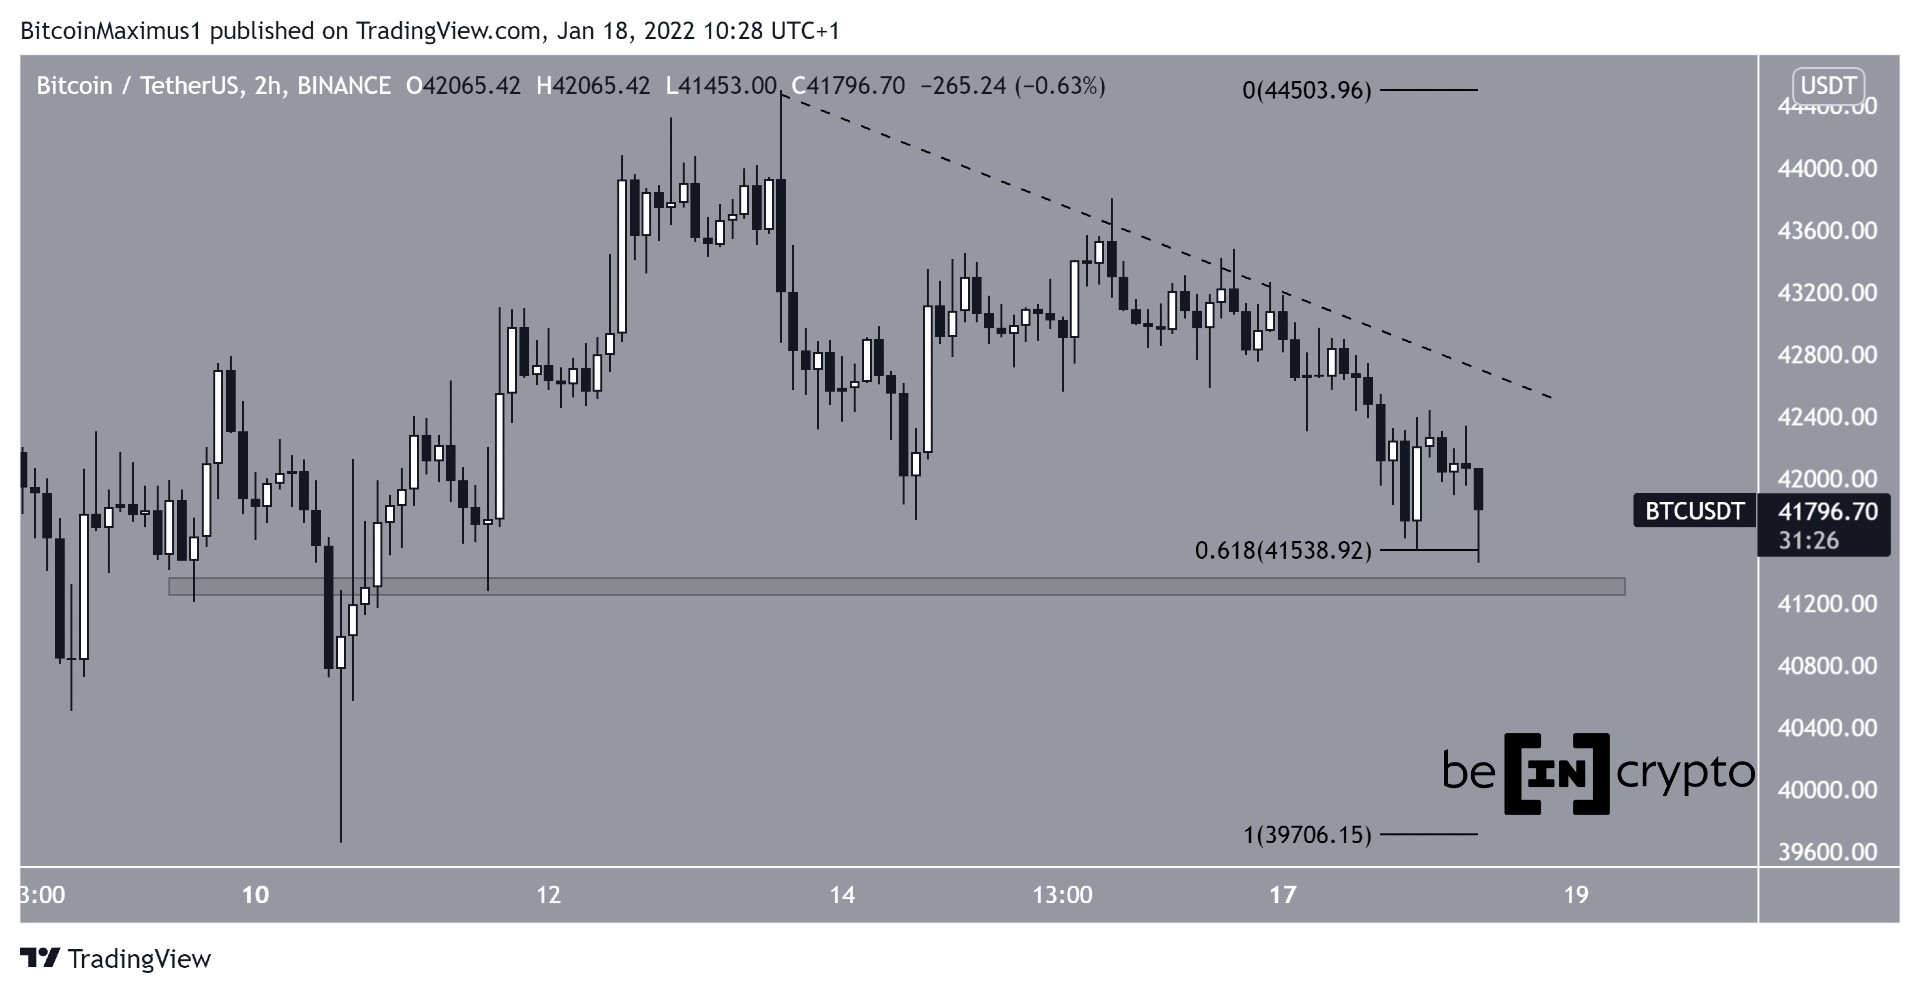
BTC has been decreasing underneath a descending resistance line since Jan 13. So far, it has reached a low of $41,453 on Jan 18. The low was made just above the 0.618 Fib retracement level at $41,540. Apart from this area, there is a horizontal support level of $41,300.
BTC rebounded after and has increased slightly since, leaving a long lower wick. This is a sign of buying pressure.
A breakout over the resistance line would likely confirm that the short-term correction is complete.
ETH
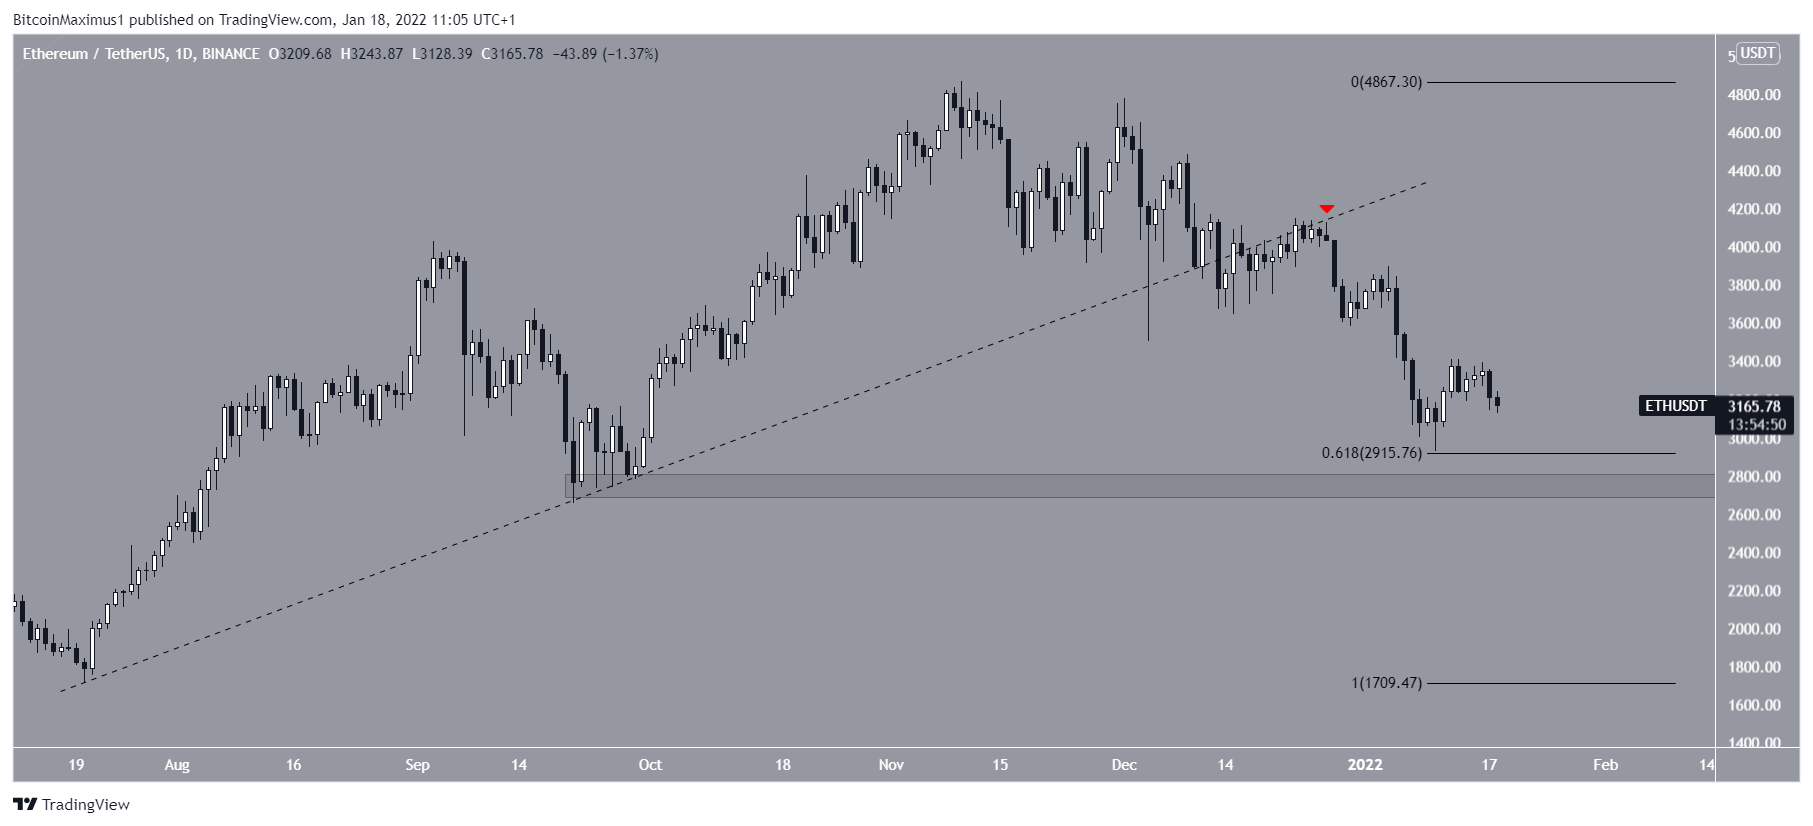
On Dec 13, ETH broke down from an ascending support line. It validated the line as resistance five days later (red icon) and has been moving downwards at an accelerated rate since.
Similar to BTC, ETH is trading just above the 0.618 Fib retracement support level at $2,915 and it has strong support around the $2,700 range. However, there are currently no bullish reversal signs in place in technicals indicators.
XRP
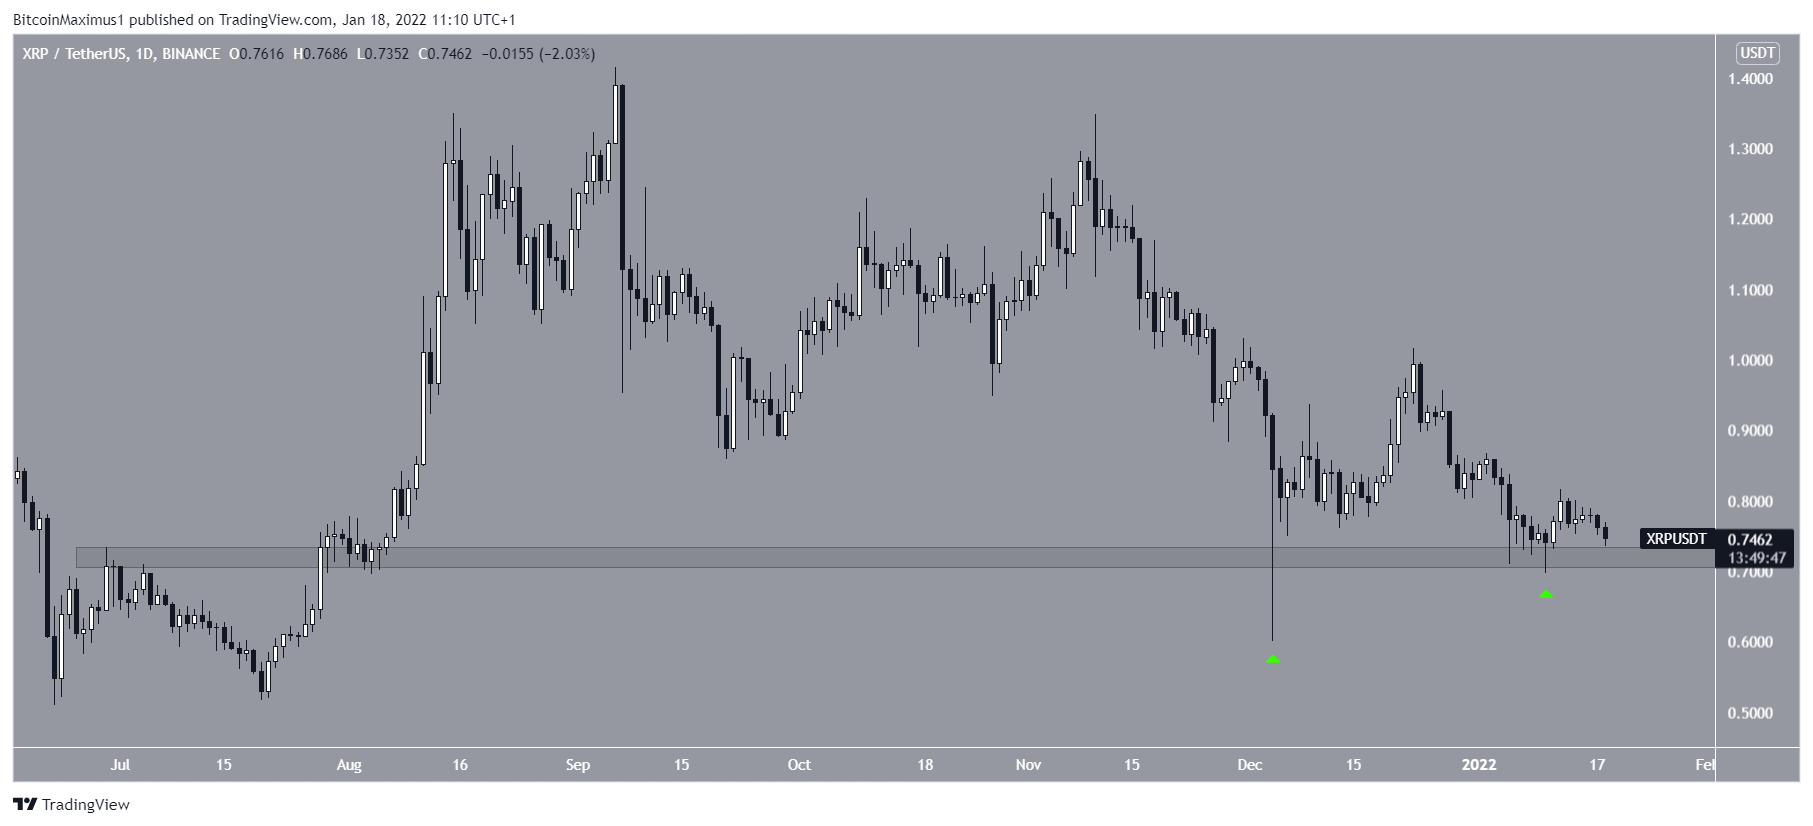
XRP has been falling since Sept 6 after it reached a local high of $1.41. This decrease led to a low of $0.60 on Dec 4. XRP bounced back after, creating a significantly long lower wick (green icon), indicating buying pressure.
It returned to the same area on Jan 5, creating another shorter lower wick.
While XRP is still trading above strong support, there are no bullish reversal signs in place.
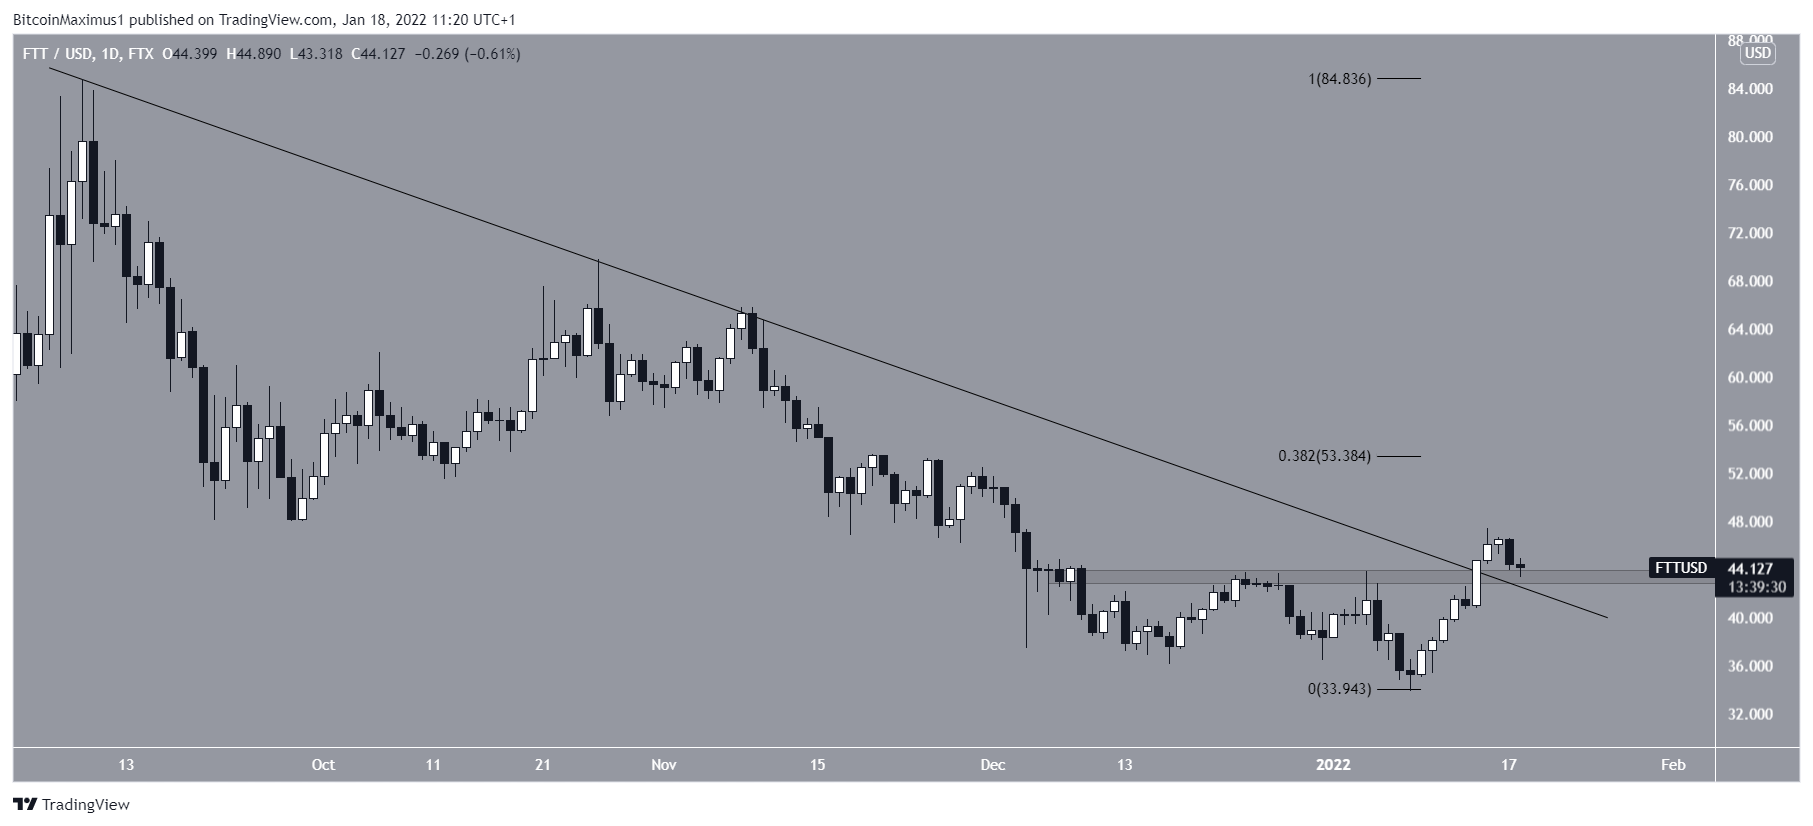
FTT
FTT had been decreasing under a descending resistance line since Sept 7, leading to a low of $33.80 on Jan 8. The price managed to rebound after hitting this low broke out above the line, suggesting that the corrective phase is complete.
Currently, FTT is attempting to validate the resistance line as support.
It’s possible that FTT has completed its correction and will now begin trending upwards toward a new all-time high price.
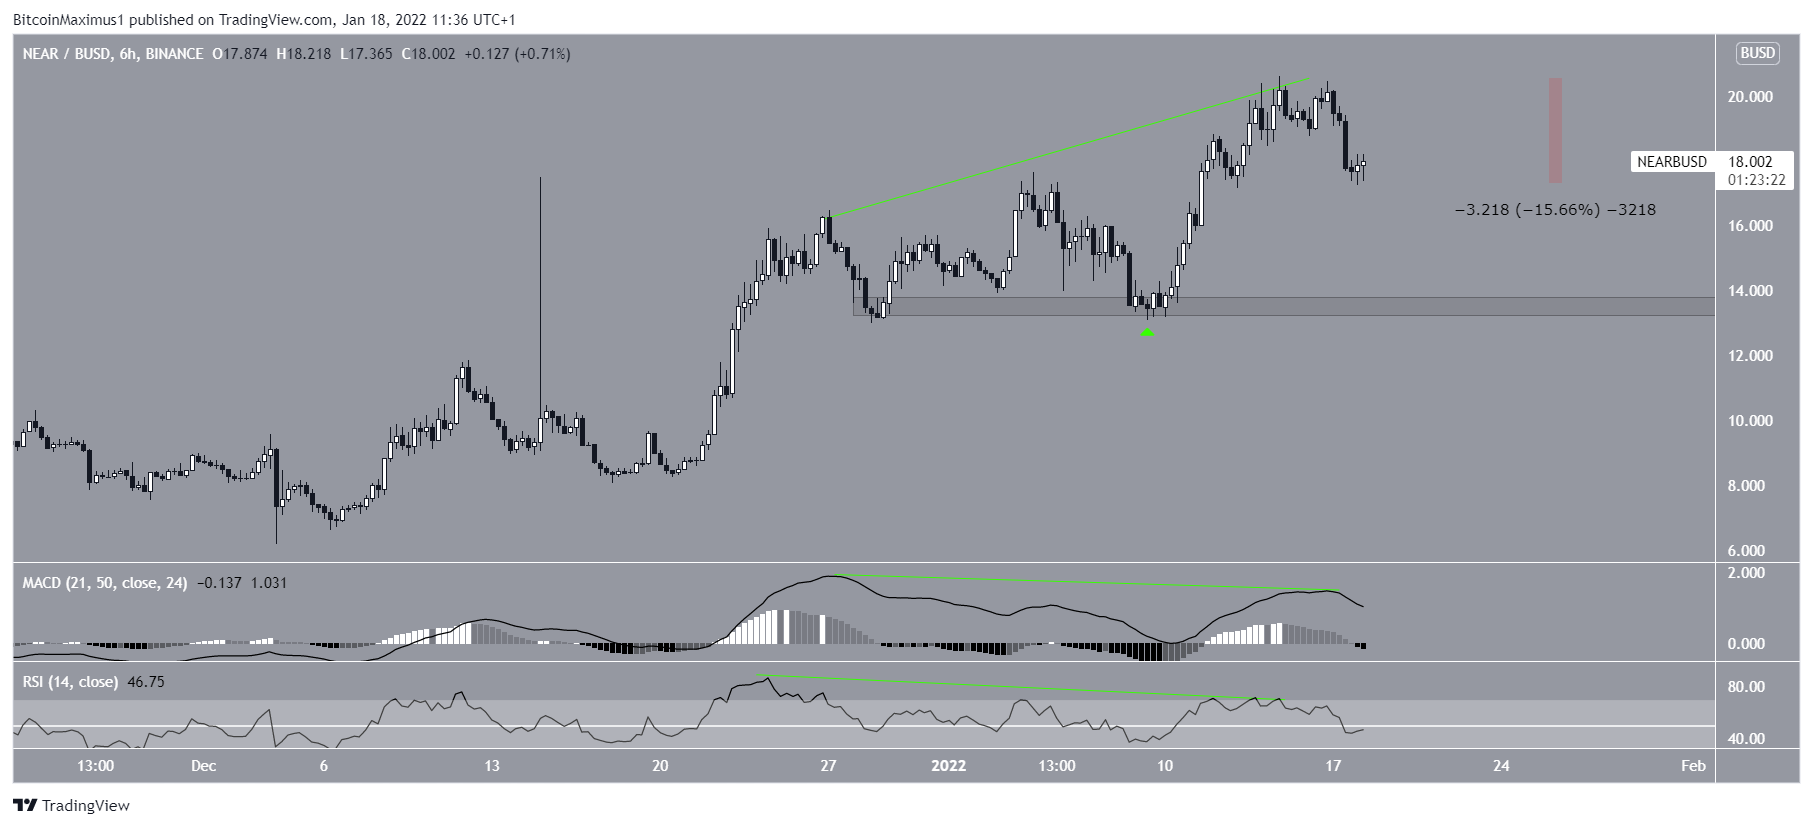
NEAR
NEAR had been moving upwards since Jan 9 after bouncing from the $13.10 horizontal support area (green icon). This led to to a new all-time high price of $20.60 on Jan 14.
However, the high was combined with significant bearish divergences (green lines) in both the RSI and the MACD. These are signs that often precede bearish reversals. Since the divergence has come into play, NEAR has fallen by 15.6%.
If this continues, it’s likely that NEAR could revisit the $13.10 area to test the support once again.
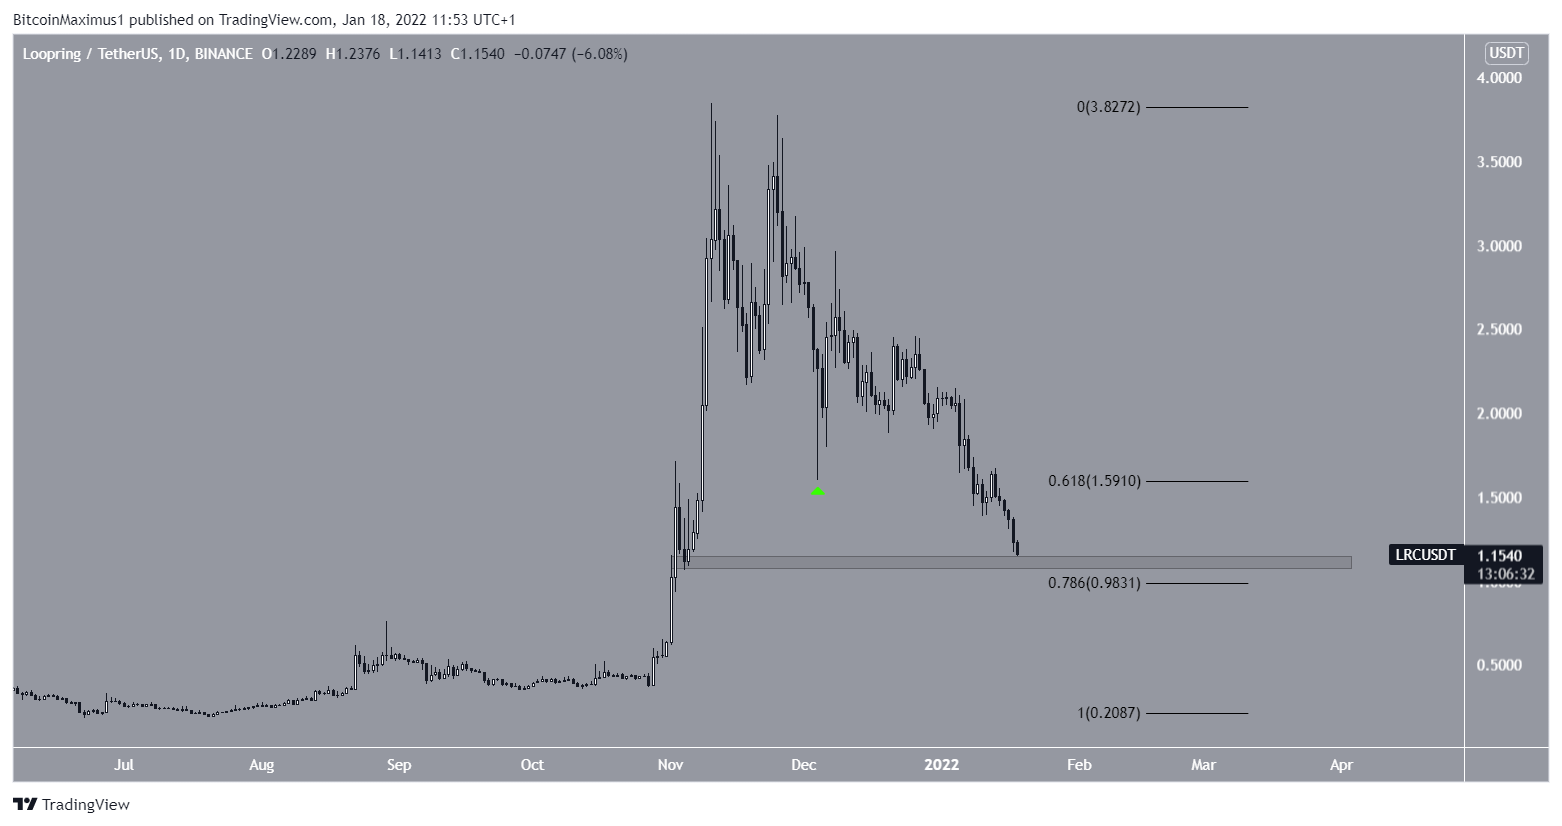
LRC
LRC has been falling since Nov 10 after reaching an all-time high price of $3.85. On Dec 4, it rebounded as soon as it reached the 0.618 Fib retracement support level at $1.59 (green icon).
Despite this, LRC continued to break down and is currently very close to the $1.10 horizontal support area. This is just above the 0.786 Fib retracement support levels.
Due to the confluence of these two levels, it’s possible that this area will help to support LRC in a rebound to the 0.618 Fib level near $1.60.
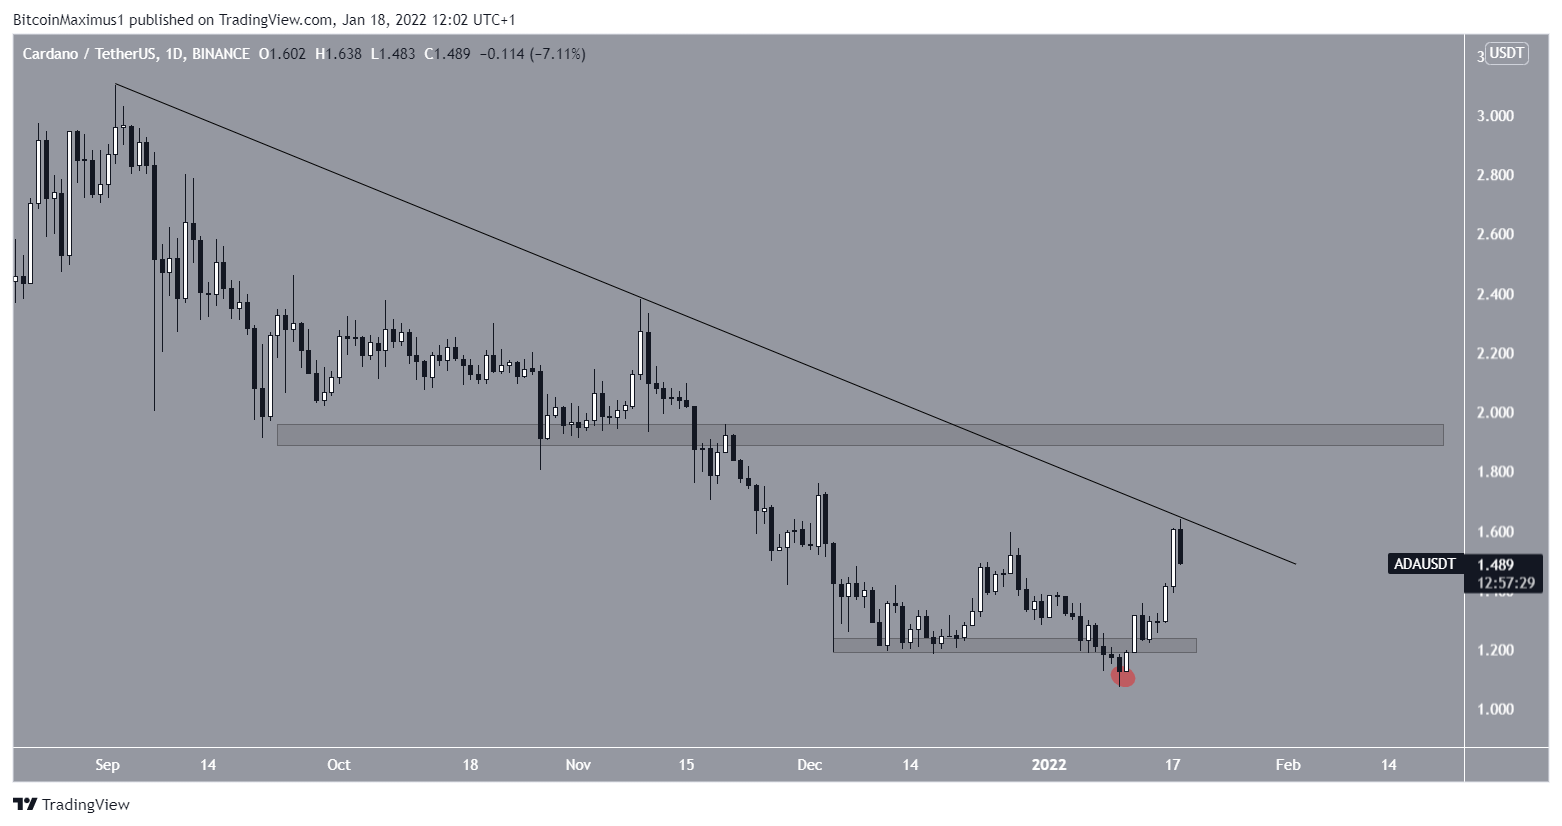
ADA
On Jan 8, ADA appeared to have broken down from the $1.20 horizontal support area (red circle) but managed to reclaim the level shortly after and has been moving upwards since. This successful reclamation of support created a double bottom pattern.
Currently, ADA is trading just below a descending resistance line that has been in place since the August all-time high price.
A successful breakout could potentially take ADA to test the previous horizontal support near $1.90.