DCR coin price action gives a bullish breakout of the falling wedge pattern with a 1500+% jump in trading volume teasing a bull run above $100 shortly. Decred is a cryptocurrency based on blockchain that was introduced in February 2016. DCR token and the protocol behind it were created to promote an open and democratic governance system. It is designed so that the community has the authority to approve any changes or transactions made to the protocol. Therefore, there is no way for the large Decred holders to influence the functioning of the system. The driving force for the founding of Decred is that it is an organization known as Company 0. Its purpose is to harness blockchain technology to provide better security for personal data and allow organizations to be more flexible in their projects. Let us move ahead to read about Decred technical analysis.
Past Performance of DCR
DCR coin price shows a growth of more than 25% in the past 24 hours with a jump of 1650% in the intraday trading volume. Thus, resulting in a huge bullish engulfing candlestick in the daily chart. Moreover, the increasing prices result in the long-coming wedge pattern breakout. 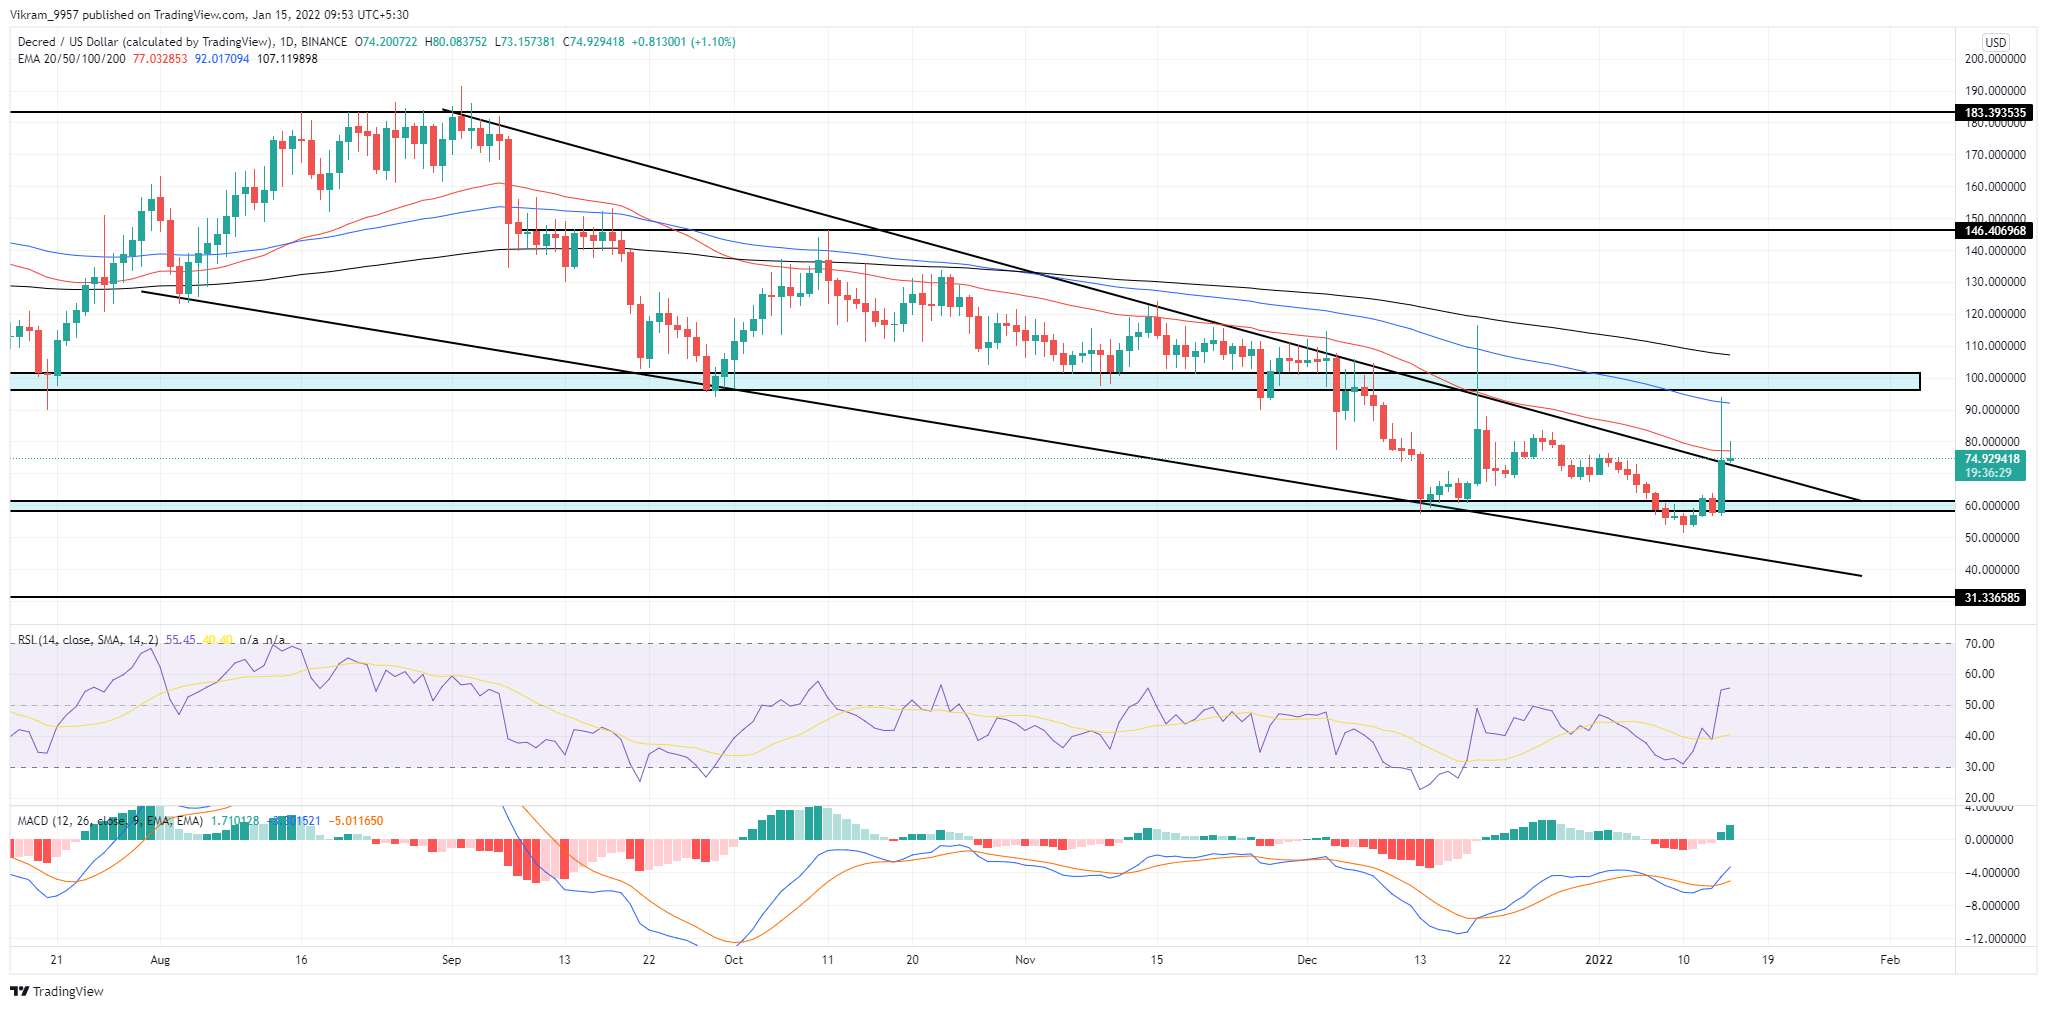 DCR/USD Daily Chart
DCR Technical Analysis
The DCR coin price finds demand near the support zone at $60 resulting in the price jump and the breakout of a long-coming resistance trendline. However, the resistance zone of $100 is a high selling pressure area that can be hard to overcome. The crucial EMAs (50, 100, and 200) maintain a falling trend with the 50-day EMA providing dynamic resistance resulting in the higher price rejection. However, the increasing demand may soon result in the breakout of these EMAs, which will light a buying spot. The RSI indicator at 55% shows a steep rise in slope as it breaks above the center mark in the daily chart. However, the 14-day SMA remains below the central mark, indicating the bullish pressure is yet to sustain. The MACD indicator shows a bullish crossover in the MACD and signal lines with the gap increasing between the lines. Moreover, the growth in bullish histograms reflects a rise in underlying bullishness. Therefore, the technical analysis indicates a sharp rise in bullishness which is yet to sustain and might find rejection near $100. Moreover, the DCR price action indicates high price rejection from the 100-day EMA near $100.
Upcoming Trend
The breakout of the falling wedge pattern with a boom in buying pressure helps DCR gain overnight bullish attention. However, the price struggles to sustain above the breakout and might succumb within the pattern. The price action suggests support levels at $60 and $30 can halt the falling price in the event of a downfall. However, if the buying pressure sustains, the selling pressure at $100 and the 200-day EMA will be hard to overcome. In conclusion, the chances of prices falling into a pattern is high compared to a bull run. However, traders need to be patient and wait for the price action confirmation. At press time, the sentiment chart gives an overall "BUY" signal for the Decred token.