The FTT coin price action shows a bullish reversal from the support trendline teasing a breakout of the falling wedge pattern.
The team that runs FTX includes many of the most prominent cryptocurrency traders in the last few years. They have discovered issues with the many major crypto futures exchanges and made the decision to develop their own exchange.
FTX claims it stands apart due to features such as clawback protection as well as centralized collateral pools and a universal settlement using stablecoins.
Let us move ahead to read about FTT technical analysis.
Past Performance of FTT
The FTT coin price action forms a falling wedge pattern with a 30% downfall in the past two months. The prices approach the resistance trendline of the falling wedge pattern. Moreover, the 100% jump in the intraday trading volume showcases a jump in buying pressure. Therefore, the possibility of a bullish breakout of the pattern increases significantly.
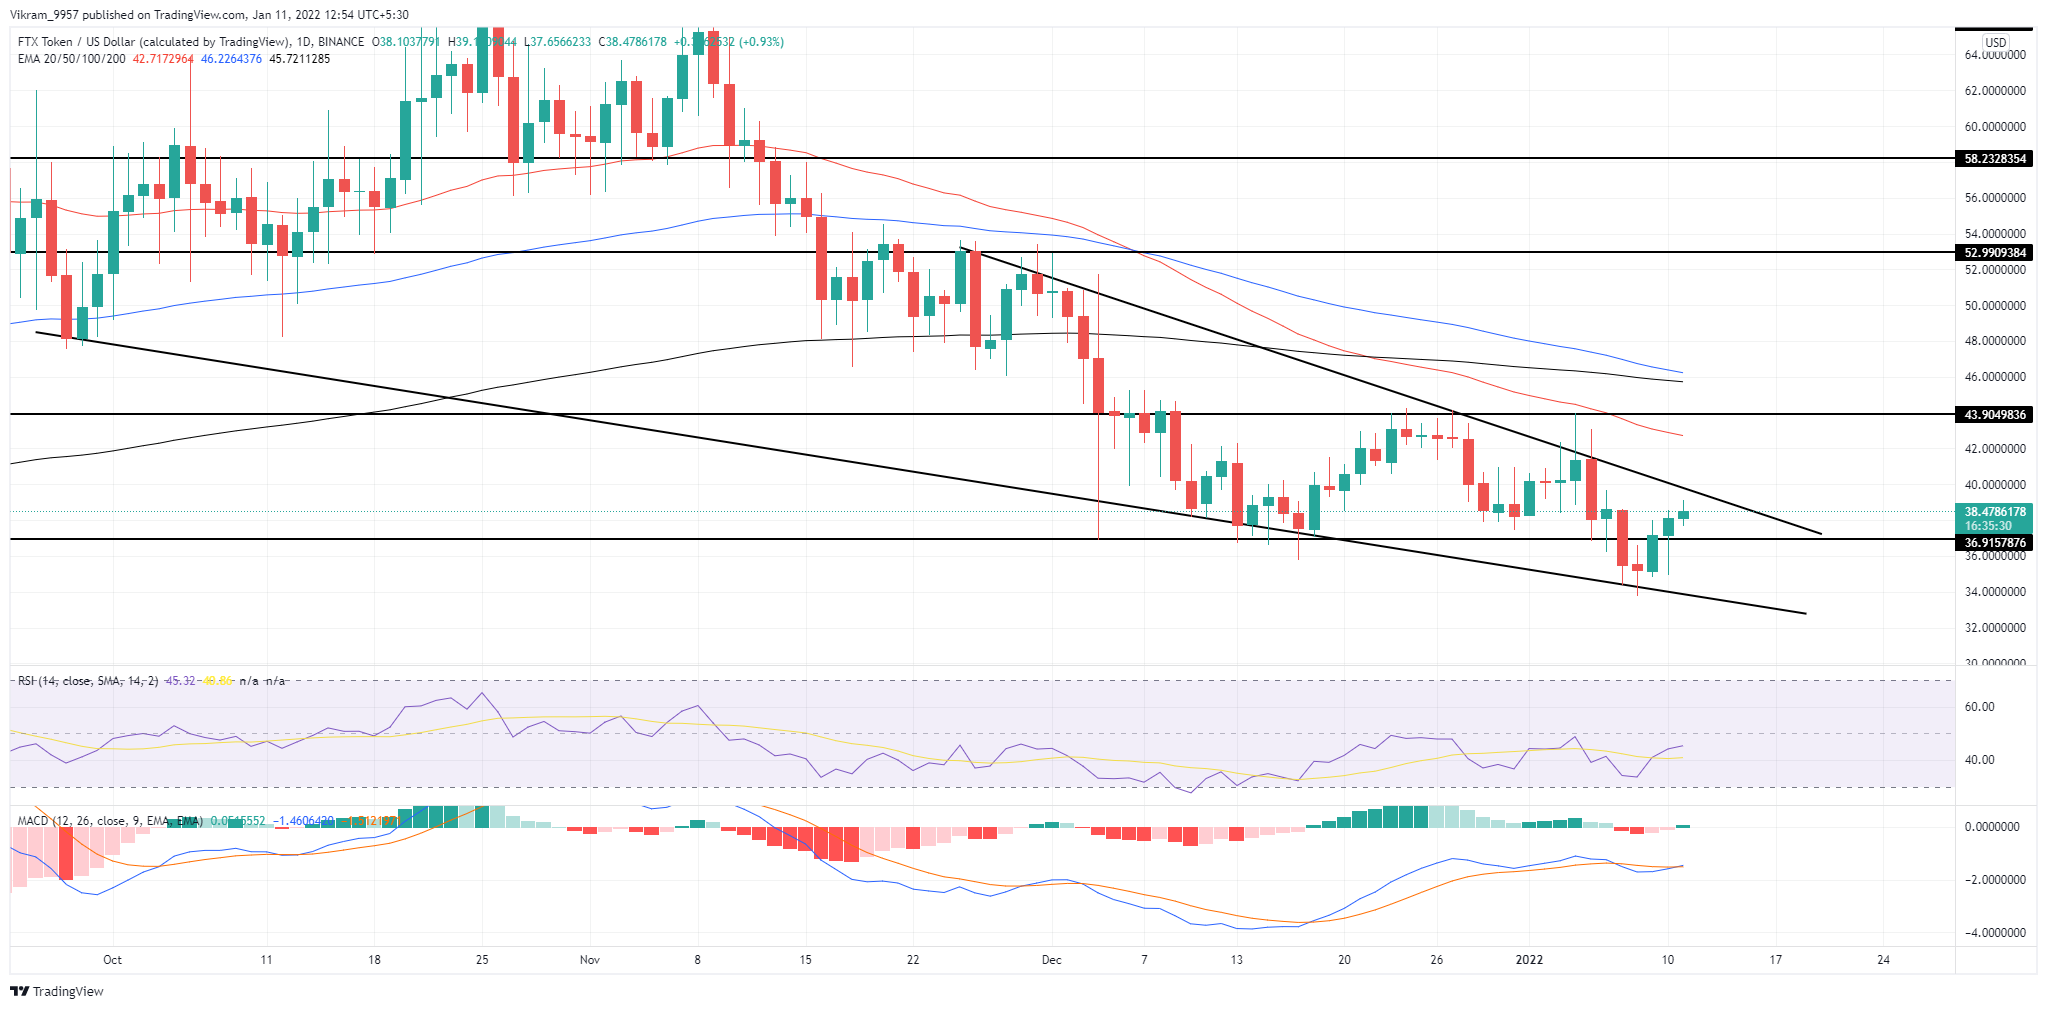
FTT/USD Daily Chart
FTT Technical Analysis
The FTT coin price action shows a significantly lower price rejection with a hammer candle formation. Therefore, a price jump to $44 above the trendline is possible.
The crucial EMAs (50, 100, and 200) show a bearish alignment as the price falls below all the daily EMAs. However, the recent jump in buying pressure delays the bearish crossover of the 50 and 100 day EMAs.
The FTT price action indicates a resistance pivot level at $44 and $53 above the falling wedge. The support levels are at $35 and $30 which can halt the downfall.
The RSI indicator at 45% shows the slope giving a bullish crossover with the 14-day SMA as it rises higher towards the central mark. Therefore, the indicator shows a rise in underlying bullishness.
The MACD indicator shows a bullish crossover as the MACD and signal lines avoid a downfall below the zero line. Therefore, the indicator suggests a high possibility of a bullish breakout.
Upcoming Trend
The FTT technical analysis shows a high possibility of a bull run above the falling wedge in the daily chart. Therefore, traders can shortly find a bullish entry spot upon pattern breakout.