- Polkadot price analysis is bearish today.
- Resistance for DOT/USD is present at $24.9.
- Support for DOT/USD is present at $22.8.
The Polkadot price analysis shows the price action is facing bearish resistance once again as the bearish trend emerged after only one day of bullish recovery. The price has decreased to the $23.6 level today, and it is expected that it will go through further decline. There have been constant ups and downs in the price movements since the past week, and today the bears are again maintaining the lead. The chances are getting dim for the bulls to find recovery, as it seems like a lower low is being set.
DOT/USD 1-day price chart: Drop-in DOT price recorded as bears attempt for the lead
The 1-day Polkadot price analysis shows a lower low is to be set by the end of the trading session, as DOT/USD continues its bearish cycle. DOT is currently trading at $23.6 at the time of writing while reporting a 5.83 percent loss in value over the last 24 hours and a huge 20.94 percent loss over the past week, as the bearish trend is quite overwhelming. The DOT/USD trading volume is comparatively 9.7 percent up than yesterday’s level, but the market cap has decreased by 5.39 percent.
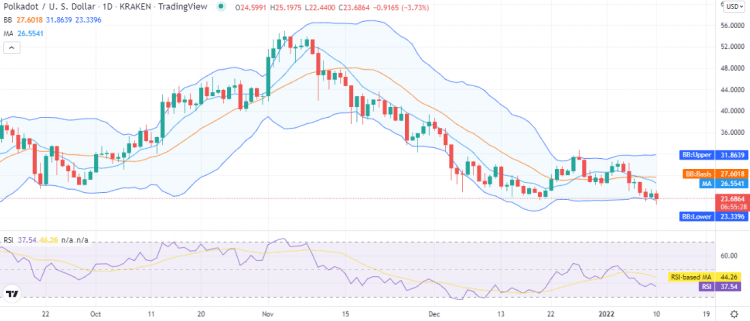
The volatility has been mild and almost constant during the last 24-hours, which indicates that a bullish comeback would not be easy during the coming days. The Bollinger bands indicator, whose upper value is settled at $31.8 and the lower value at $23.3, is just below the price level. The Relative Strength Index (RSI) curve is headed downwards at index 37, indicating the selling activity of DOT assets.
Polkadot price analysis: Recent developments and further technical indications
The 4-hour price chart for Polkadot price analysis shows the price trend continued upside at the start of today’s trading session as the price recovered up to $24.9 during the night, but bears struck back in the morning and degraded the price to $23.2. A swing exceptionally low towards 22.45 was also observed at an instance, but bulls are again seen trying to resist as the last candlestick on the 4-hour chart is green, and the price has been again elevated to $23.6.
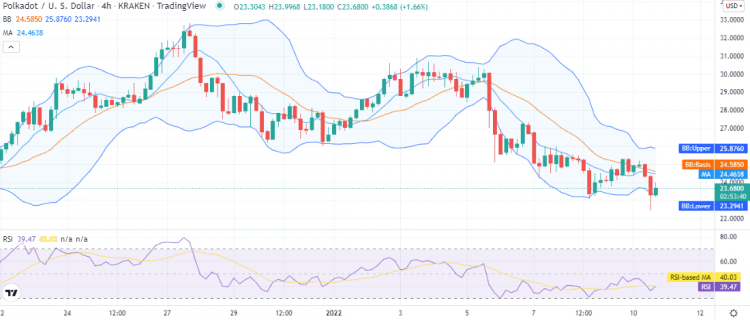
The 4-hour price chart shows the volatility indicator’s arms are traveling downwards as the upper limit has come down to $25.8 level, and the lower limit of the Bollinger bands has gone further down to 23.2. The indicator is hinting at a downwards breakout, which on the other hand, is another bearish sign for the coming hours. The RSI has taken an upwards turn due to the recent bullish support, and the indicator’s score is 39 at the moment.
Polkadot price analysis conclusion
The Polkadot price analysis suggests the coin has mostly covered range downwards today as the price has overall decreased substantially. Despite the bullish activity recently seen, we think DOT’s price action is under bearish pressure as the RSI values are quite low on both charts; we expect DOT’s price to decrease further over the day.
Disclaimer. The information provided is not trading advice. Cryptopolitan.com holds no liability for any investments made based on the information provided on this page. We strongly recommend independent research and/or consultation with a qualified professional before making any investment decisions.