- Uniswap price analysis is bearish today.
- The strongest resistance is present at $19.789.
- UNI/USD is currently trading at $15.47.
According to the Uniswap price analysis, the market is presently following a significant downward trend below $17 and is expected to maintain it. Following its peak at $20 on January 5, 2022, where the price fluctuated from $18.08 to $19.83, it plummeted dramatically. However, rather than retaining its value, the price dropped significantly below $17.
UNI/USD is currently trading at around 15.47$, which is within an incredibly bearish zone. The next strong resistance lies at 17$. If UNI/USD breaks through this resistance level in any way (for example, if the bulls manage to push prices above 17$), then there will be an upward swing towards 21-22$.
According to the Uniswap price analysis, some signs anticipated breaking the price below $10. This price point was first broken through during the mid-December 2018 bull run when the price simultaneously broke below $10 and 20 days later broke below $12. Since then, UNI/USD has been trading between 10$ and 15$, with the current levels above 15$.
The current bearish trend will probably continue as long as there are no large buy orders for UNI/USD. Yesterday a huge buy order was made at 16$, but it didn’t show significant results. Moreover, because of recent market movements, it is unlikely that this downward trend will end anytime soon.
UNI/USD 4-hour price analysis: Slight bullish signals
Uniswap price analysis indicates that market volatility increases rapidly, making Uniswap prices more prone to wild swings. The Bollinger band’s upper limit is set at $19.78, a resistance barrier. The lower boundary of the Bollinger band is set at $16.824, which rather than providing support, serves as another barrier against downward movement.
The UNI/USD pair appears to be crossing below the lower limit of the Bollinger Bands, indicating a market breakout. This finding implies that the likelihood of a price reversal has increased significantly.
A bearish trend is indicated by the UNI/USD exchange rate passing beneath the curve of the Moving Average. Bears control the market now, but uncertainty has grown considerably, suggesting that the trend could change at any time.
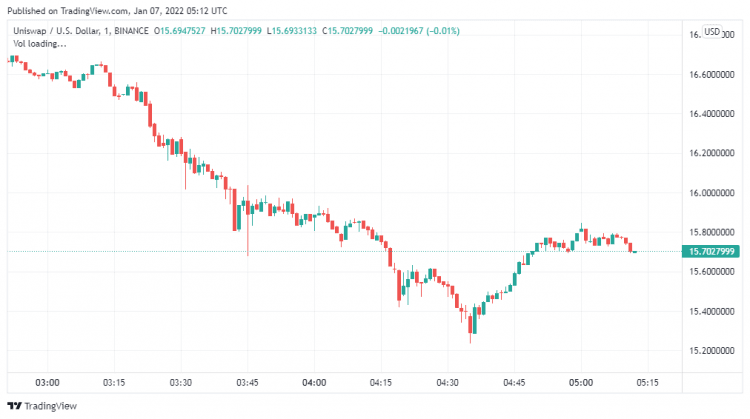
UNI/USD 4-hour price chart source: Trading view
The Uniswap price study reveals that the Relative Strength Index (RSI) is 39, indicating UNI/USD is neither overvalued nor undervalued. The RSI may be used to indicate an improving market trend and a chance of recovery after a rise in which the market trend is rising.
Uniswap Price Analysis: Conclusion
We can deduce that the bears have reclaimed market control from Uniswap’s price analysis. If this persists, Uniswap may experience a significant fall more remarkable than it already has. Uniswap has seen a rocky bearish movement with huge swings in recent days, suggesting that the bulls must up their game if they want to regain momentum and raise the price of Uniswap. The bears still have the upper hand, but a trend change is likely based on all market data.
Disclaimer. The information provided is not trading advice. Cryptopolitan.com holds no liability for any investments made based on the information provided on this page. We strongly recommend independent research and/or consultation with a qualified professional before making any investment decisions.