- The Aave price analysis is bearish today.
- Resistance is present at $252.
- Support for AAVE is present at $232.
The Aave price analysis reveals that a downward movement in AAVE/USD price has been observed today, which has cast quite a negative impact on the overall coin value. The price has been degraded up to $238 value after the bearish trend. Although a constant improvement in price was recorded two weeks earlier, today’s trend has proved in favor of the bears. The selling momentum is to intensify in the approaching hours as well.
AAVE/USD 1-day price chart: Aave Price takes backward flight as bears continue to lead
The 1-day Aave price analysis shows a further decrease in price following yesterday’s bearish trend. The AAVE/USD price has now stooped down to $238.3 at the time of writing, losing more than two percent value during the last 24 hours, which is quite discouraging for the coin. There is quite a gap between the moving average and the price. The moving average (MA) is at the $255 level.
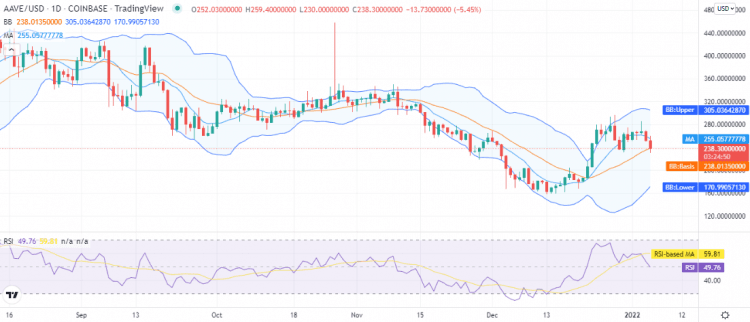
The volatility has undergone a considerable decrease during the last few days, which is why the Bollinger bands average is now maintained at $238, just below the price level. At the same time, the upper value of the Bollinger bands indicator is now standing at $305 point, whereas the lower value is at $170 point. The Relative Strength Index (RSI) score has stepped down to 49 as well.
Aave price analysis: Recent developments and further technical indications
The price has covered downward movement in the last few hours as well as the bearish momentum has been trending in the market. A steep decline in price has been recorded in the last four hours, and the bears have succeeded in taking the price down to the $238 limit. The price is still above the moving average value, which is standing at the $0.980 point.
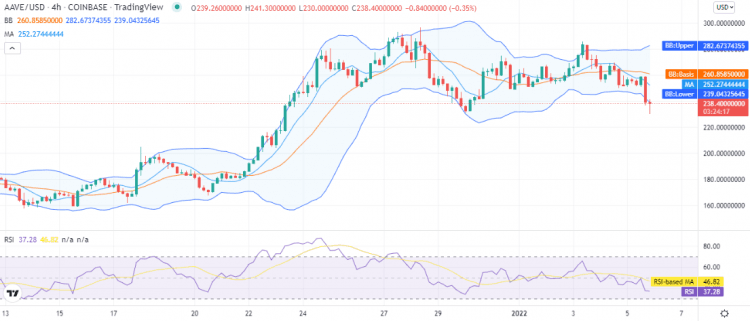
The bearish spell has plunged the price level below the Bollinger band lower level, which is $239. As the volatility started to increase again, the recent increase in volatility means that the price might touch further low points in the coming hours. As a consequence, the upper Bollinger band has now moved to the $282 position. The RSI curve has flattened at index 37 after the depreciation in price.
There is a strong bearish signal for the day as given by the AAVE/USD technical indicators chart. We can see three indicators are present on the buying position, nine indicators on the neutral position, and 14 indicators on the selling position, out of a total of 26 technical indicators available for analysis.
Aave price analysis conclusion
The Aave price analysis suggests the bearish trend has been continuing since yesterday, and the magnitude multiplied during the last eight hours, as a severe devaluation in price was observed recently. As both the daily and hourly price charts are predicting a downtrend, we assume the price to continue downside for the next 12 hours.
Disclaimer. The information provided is not trading advice. Cryptopolitan.com holds no liability for any investments made based on the information provided on this page. We strongly recommend independent research and/or consultation with a qualified professional before making any investment decisions.