IOTA coin price shows a bullish outbreak as it finds demands near the psychological support level at $1 and aims to show another 30% jump.
IOTA is a distributed ledger with one significant difference that it's not an actual blockchain. Its proprietary technology is referred to as Tangle, which is a system of nodes that verify transactions.
The platform's foundation claims it offers much faster speed than traditional blockchains and is a perfect place to establish a footprint for the rapidly expanding IoT ecosystem.
Let us see what the IOTA technical analysis suggests:
Past Performance of IOTA
In the last 48 hours, the IOTA coin price jumped more than 25%, resulting in the bullish breakout of the consolidation range. Moreover, the recent retracement shows a possibility of retesting the breakout level.
Therefore, an entry opportunity awaits at the dip in coin price. However, the 300% jump in intraday trading volume undermines the chances of a significant dip.
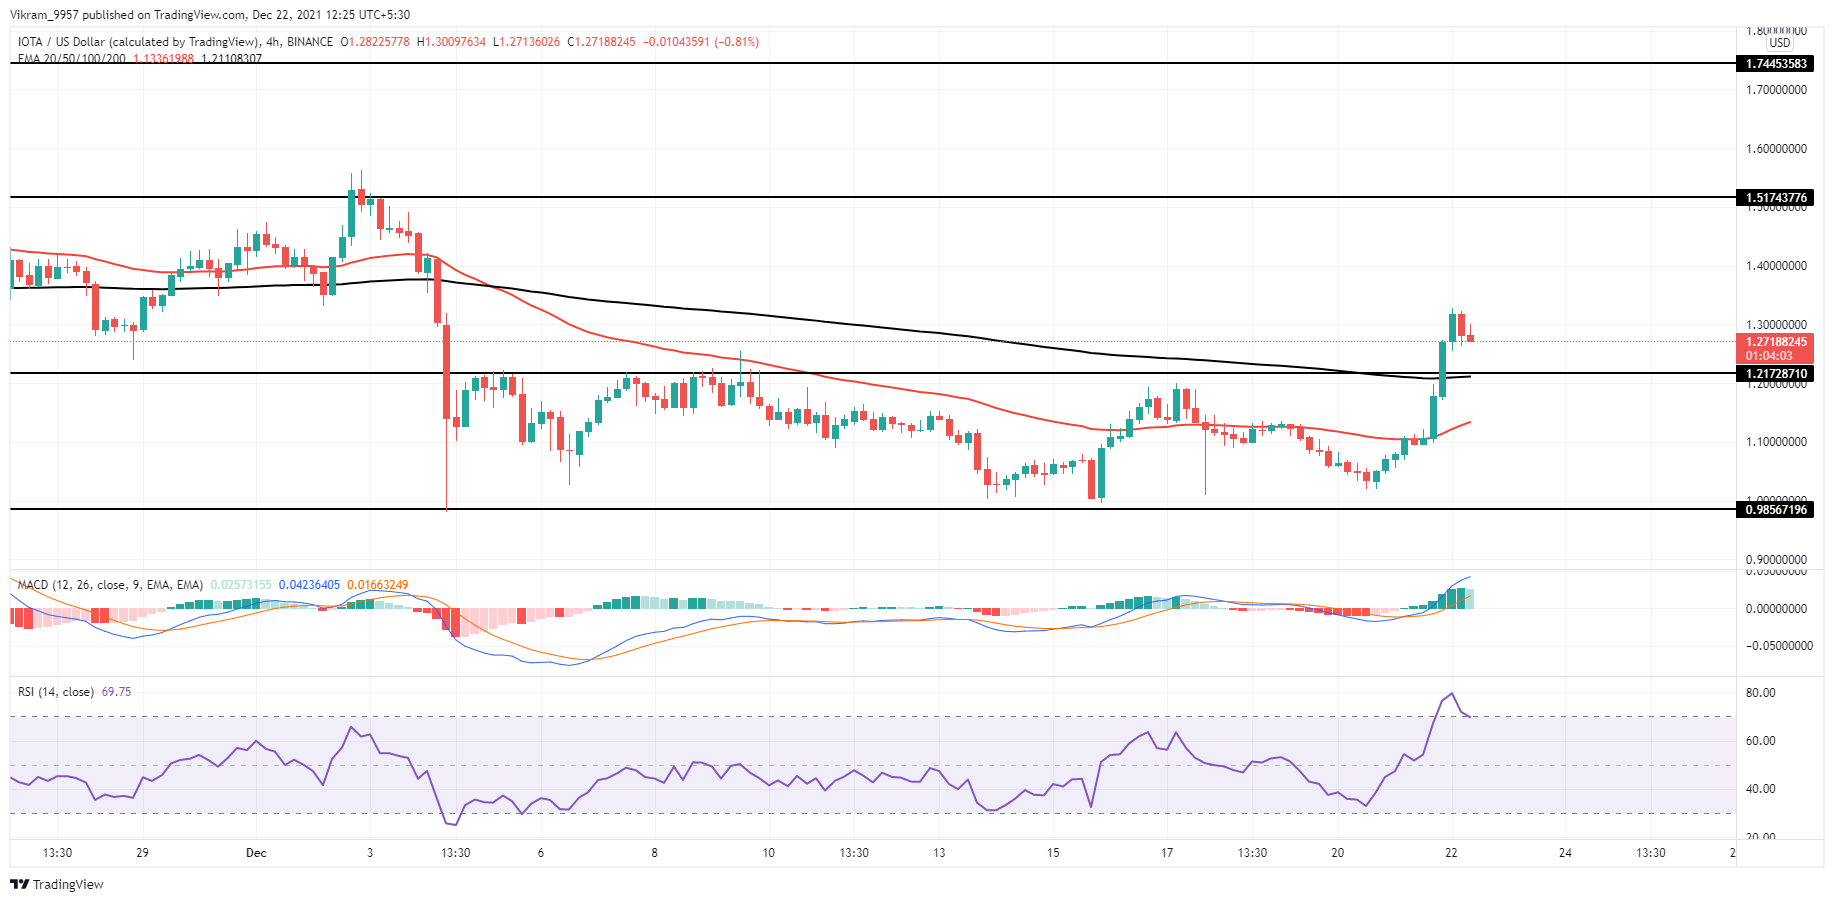
IOTA/USD 4-hour Chart
IOTA Technical Analysis
The rising IOTA coin price results in the breakout of $1.25 in the 4-hour chart. Therefore, the retracing price can be considered a retest to regain bullishness.
Moreover, the price breaks above the 200-period EMA in the 4-hour and the retracement retests the breakout. Additionally, the rising 50-period EMA shows a high possibility of a golden crossover.
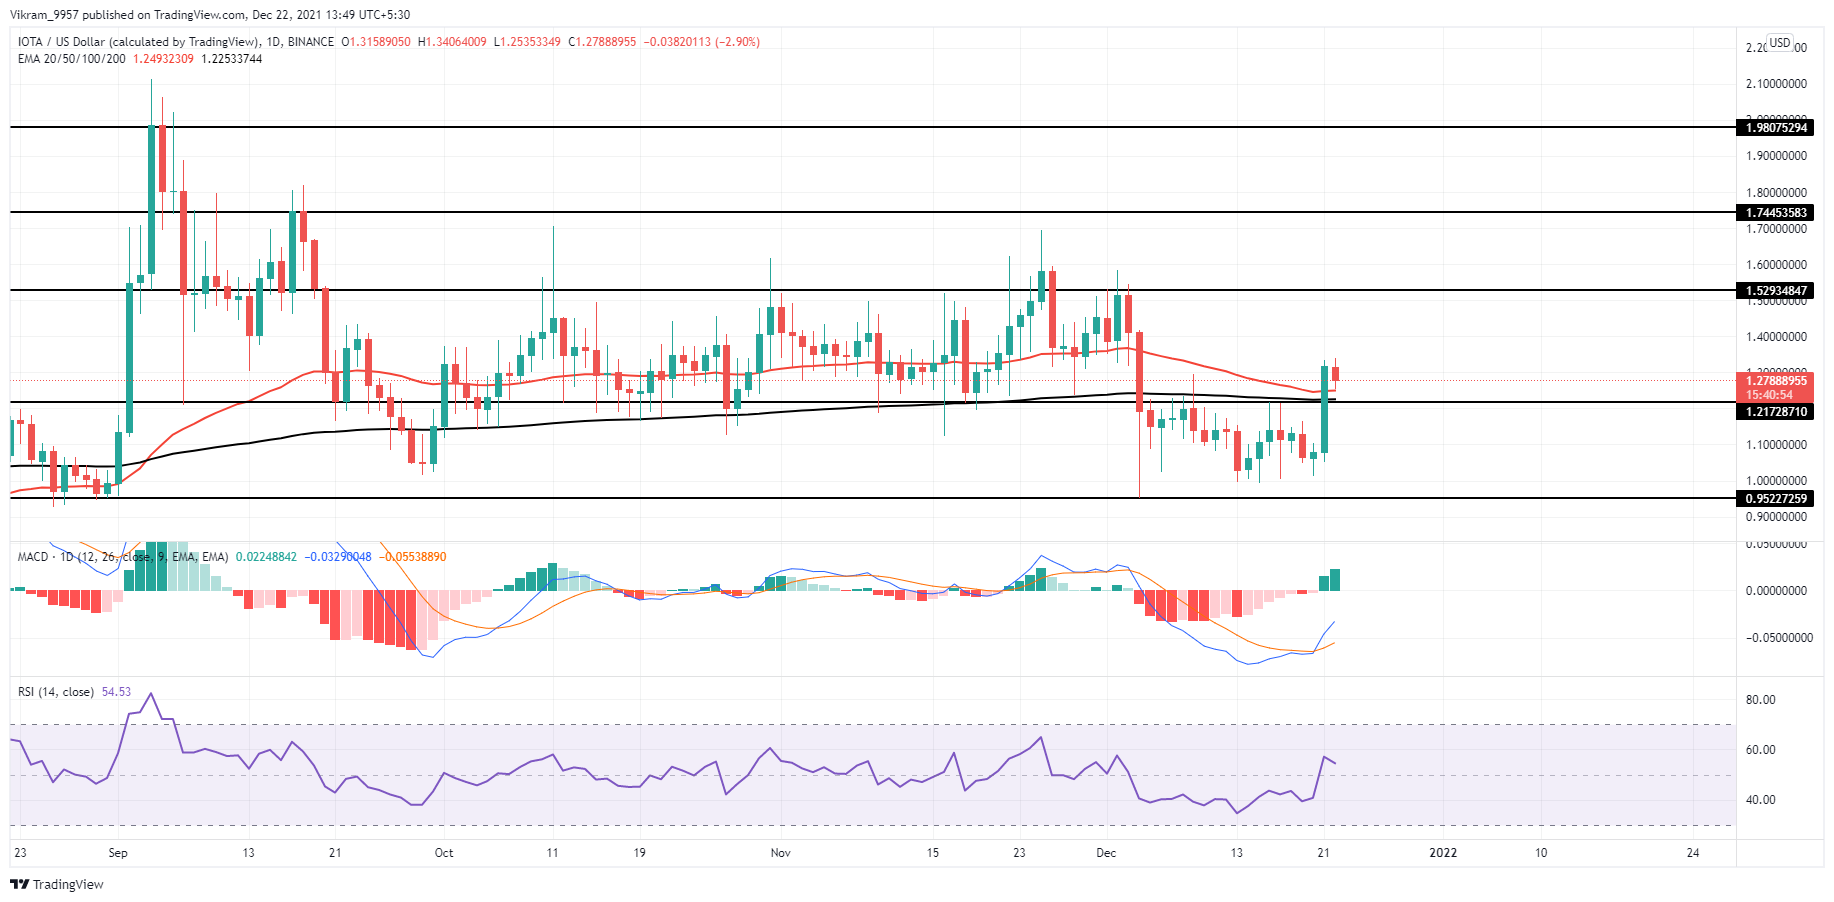
IOTA/USD 4-hour Chart
The RSI indicator at 54% breaks above the central line in the daily chart after the sudden spike. Moreover, it still showcases a rise in underlying bullishness as the slope sustains in the nearly overbought zone.
Furthermore, the MACD indicator shows a spike in the MACD line after the bullish crossover in the daily chart. Thus, increasing the gap between MACD and the signal line. Therefore, the traders can expect the bullish trend to continue in IOTA coin prices.
Upcoming Trend
The technical indicators forecast a continuation of the bullish trend in IOTA coin price. Moreover, the price action reflects a boom in buying pressure with the bullish engulfing candlestick in the daily chart.
Therefore, traders can find an entry opportunity in the short-term retracement. Moreover, traders can place a bullish target at $1.5 or even $2 if the buying pressure sustains.