- Following recent price volatility, Chainlink (LINK) facing tough resistance around $4.9.
- While Bitcoin remains steady, the price of Chainlink has continued to surge over the past days.
- The bullish sentiment may end soon if Link doesn’t break above $5
LINK-USD: Trapped In a Key Resistance Area
Key Resistance Levels: $4.9 – $5, $5.5
Key Support Levels: $4.4, $3.8
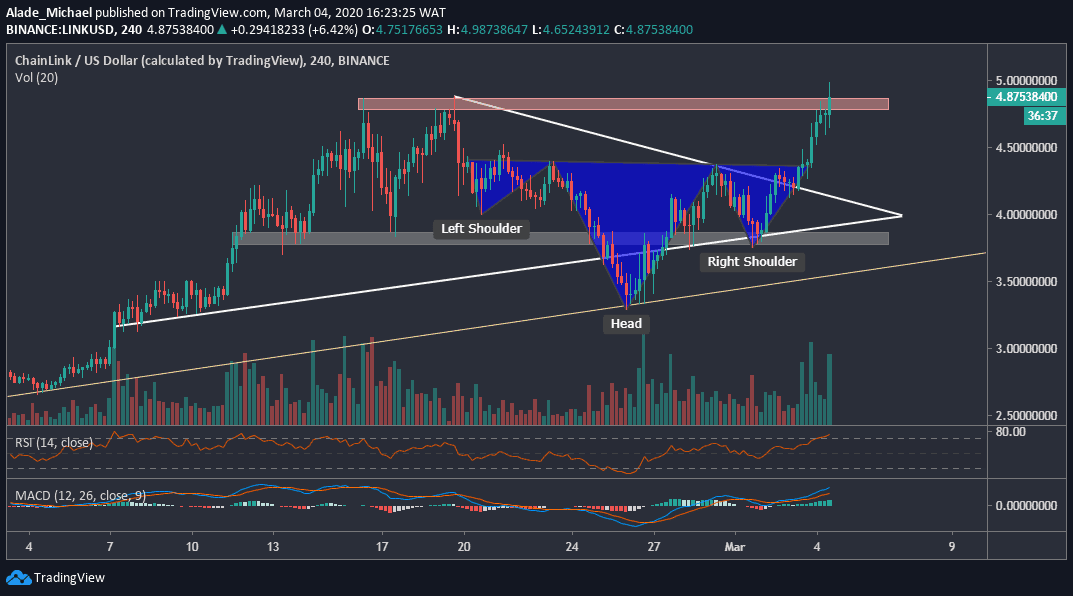
Two days ago, we mentioned the possible bullish momentum after spotting a head-and-shoulders pattern that was formed on the 4-hours chart. By then, Chainlink was trading inside a symmetrical triangle.
Following the recent volatility, Chainlink’s price has now shot up as predicted in our previous analysis. Though, the price needs to break well above the psychological level of $5 before we can confirm a new bullish cycle.
Meanwhile, Link had got rejected against the February high of $4.9, which has now become a crucial resistance level for the bulls to overcome.
Despite dropping to $4.77, Link is still up by 9.71% over the last 24-hours. We can anticipate more positive moves if Chainlink maintains the $4.4 support.
Chainlink-USD Price Analysis
Chainlink is bullish but facing a tough resistance around $4.9. If the buyers can push the price back above the red resistance area of $4.98 – $5, Link is likely to reach the next resistance at $5.5 and even above.
However, the price is rejecting at the moment. The nearest support here is $4.4 – where the neckline (of the H&S) lies. Failure to rebound from here may lead to a further dip to the right shoulder of $3.8, right in the grey-marked support area.
The bottom line here is that there’s still room for an increase in the technical MACD indicator. Though, the RSI has slightly dropped from the overbought zone to show weakness in bullish momentum. Bullish impulsive may resume if the 50 level can provide a rebound.
LINK-BTC: Technical Indicator Suggests Possible Drop For Link
Key Resistance Levels: 0.00060BTC, 0.00065BTC, 0.00070BTC
Key Support Levels: 0.00049BTC, 0.00045BTC, 0.00037BTC
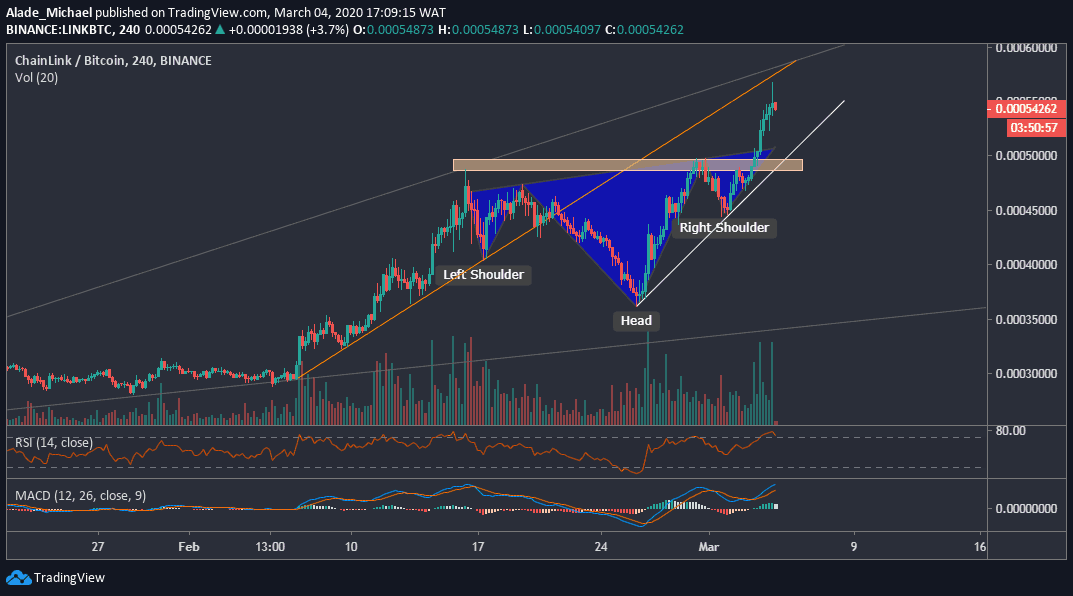
Against Bitcoin, Chainlink continued to gain nicely for the past few days. The latest head-and-shoulders formation breakout brought Link near a key resistance line, marked orange on the above 4-hours chart. Similarly, a slight rejection has dropped Chainlink to where it’s currently trading, around 0.000534 BTC level.
As we can see, it appears that the bulls are a bit overbought at the moment. We may see a minor retracement to the orange area of 0.00054 BTC, which is also supported by the white trend-line.
A drop below this line might bring a selloff to the lower grey line that was forming since early January. Nonetheless, Link’s price is still up by 10% at the time of writing.
Chainlink-BTC Price Analysis
Following the current price rejection around 0.000567 BTC level, Link is now slowly losing momentum on the 4-hour chart. From the overbought zone, we can see that the RSI has slightly crossed below 70 to suggests a sell, although the MACD indicator is just preparing for a bearish switch.
As of writing these lines, the next support level to keep an eye on is the 0.00054 BTC area. A break below this support could send Link straight to the right shoulder point of 0.00045 BTC support, followed by the head at 0.00037 BTC support.
In case Chainlink creates a higher low around the orange area, the next higher high would target 0.00060 BTC and 0.00065 BTC to test the upper grey line. A break above this line might send Link to 0.00070 BTC in no time.