- Following a six-day sideways movement, Tezos now trades around $2.75 against US Dollar with 1.32% losses over the past hours.
- Tezos maintain the 10th best-performing cryptocurrency in terms of market cap.
- XTZ could resume the mid-term bullish trend if it can overcome immediate resistance levels across trading pairs.
XTZ/USD: Tezos Keeping Sideways Trend After Two-Week Losses
Key Resistance Levels: $2.95, 3.58, $3.9
Key Support Levels: $2.6, $2.4, $2
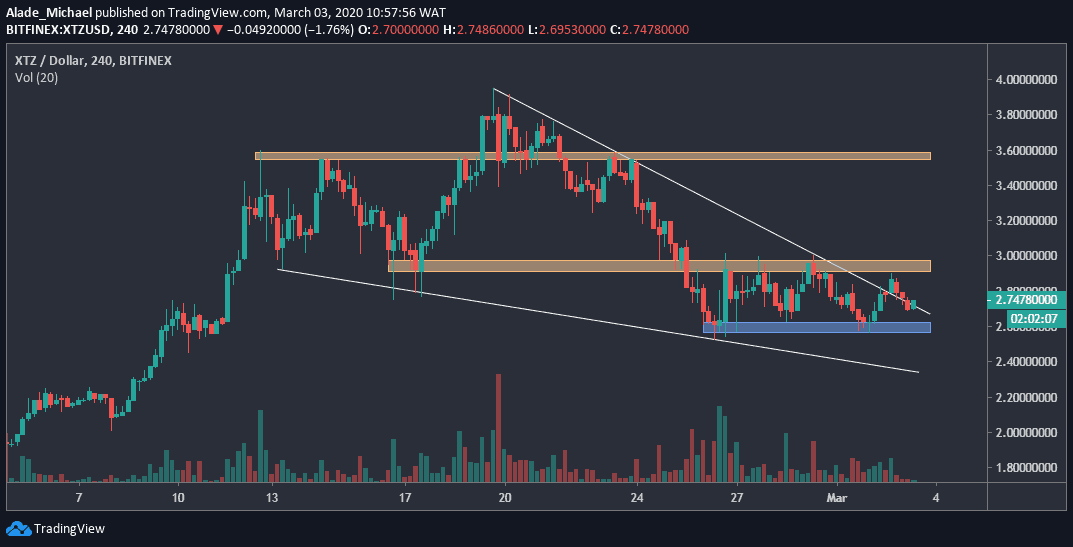
Since our previous price analysis, XTZ’s volatility declined as the bearish trend was somewhat halted by a prolonged sideways movement.
For the past six days now, Tezos has been trading in a tight range of $2.6 – $2.95 levels against the US Dollar. This shows that the market is preparing for a fresh cycle. Looking at this setup, a bullish impulsive is likely to give way to this market.
The current sideways movement shows that Tezos is stylishly breaking out of the falling wedge that captured the mid-February bearish momentum.
The only condition for a bullish confirmation is if XTZ can clearly break above the immediate orange horizontal resistance of $2.95 or even $3. Otherwise, a dip below the blue support area my cause a heavy drop in price.
Tezos Price Analysis
Zooming into the 4-hours time frame, Tezos is technically neutral but the price is currently charging towards key support of $2.6 – the blue area on the chart.
Quick support from this support level could be expected. But if XTZ fails to buy-back and drives below $2.6, the next support here is $2.4- around the wedge’s lower boundary. In case the wedge breaks down, the closest support to watch is $2 level.
On the upside, Tezos is facing strong resistance at $2.95. An increase above the first orange area would allow strong buying pressure to the second orange area of $3.58. The next resistance here is $3.9 before we can see further growth.
XTZ/BTC: Volatility Turns Low As XTZBTC Readying For Breakout, Which Direction?
Key Support Levels: 34000SAT, 40000SAT, 42000SAT
Key Resistance Levels: 28300SAT, 25000SAT, 20000SAT
Against Bitcoin, Tezos is currently trading around the 30950SAT level following a slight drop of 1.72% for the past few hours.
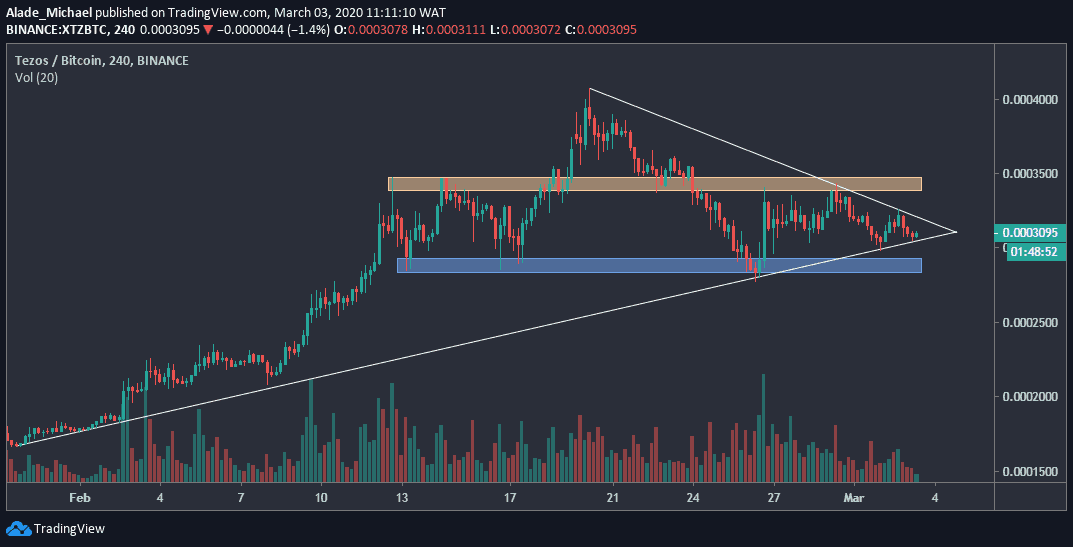
Meanwhile, the price has reached a tight area on the triangle formation, which suggests an imminent breakout on the 4-hours chart. However, this price may explode either way.
Similarly, Tezos has been struggling since the price bounced from the blue support area of 28300SAT in late February. We can expect a nice price growth if Tezos can surge above the orange area of 34000SAT resistance. For now, the next direction is still unclear.
Tezos Price Analysis
Tezos is waiting to break out from a symmetrical triangle on the 4-hours chart. Though, there’s close support and resistance in case of a sudden price surge.
On the upside, Tezos needs a clear breach at the orange zone of 34000SAT resistance before advancing to 40000SAT resistance level. From here, Tezos could mark a new high around 42000SAT level if the mentioned resistance breaks.
On the downside, the blue area of 28300SAT remains a key support level. If it fails to provide bolster, 25000SAT and 20000SAT level might be the next support to keep an eye on. As of now, the price is at equilibrium. We can anticipate huge volatility expansion once there’s an imbalance in the supply and demand.