Polkadot (DOT) is within a bear breakout pattern and may reach $20. Meanwhile, KAVA prices are firm above $3—a strong support level.
Polkadot (DOT)
The interoperable, high throughput blockchain uses DOT as the main utility currency.
Past Performance of DOT
The Polkadot token is under strong selling winds, evident in the DOTUSDT daily chart.
There could be fundamental optimism on the project, but this isn't preventing sellers from stepping up.
The DOT token is underwhelming and trailing the USD on the last week of trading.
Day-Ahead and what to Expect
As per the DOT technical analysis, the bear breakout pattern set in motion in mid-November 2021 is clear.
Presently, the DOTUSDT price is steady as it diverges from the lower BB, finding support at $24.
A close above the current $6 accumulation above $30 may revive demand, driving DOT higher.
Polkadot Technical Analysis
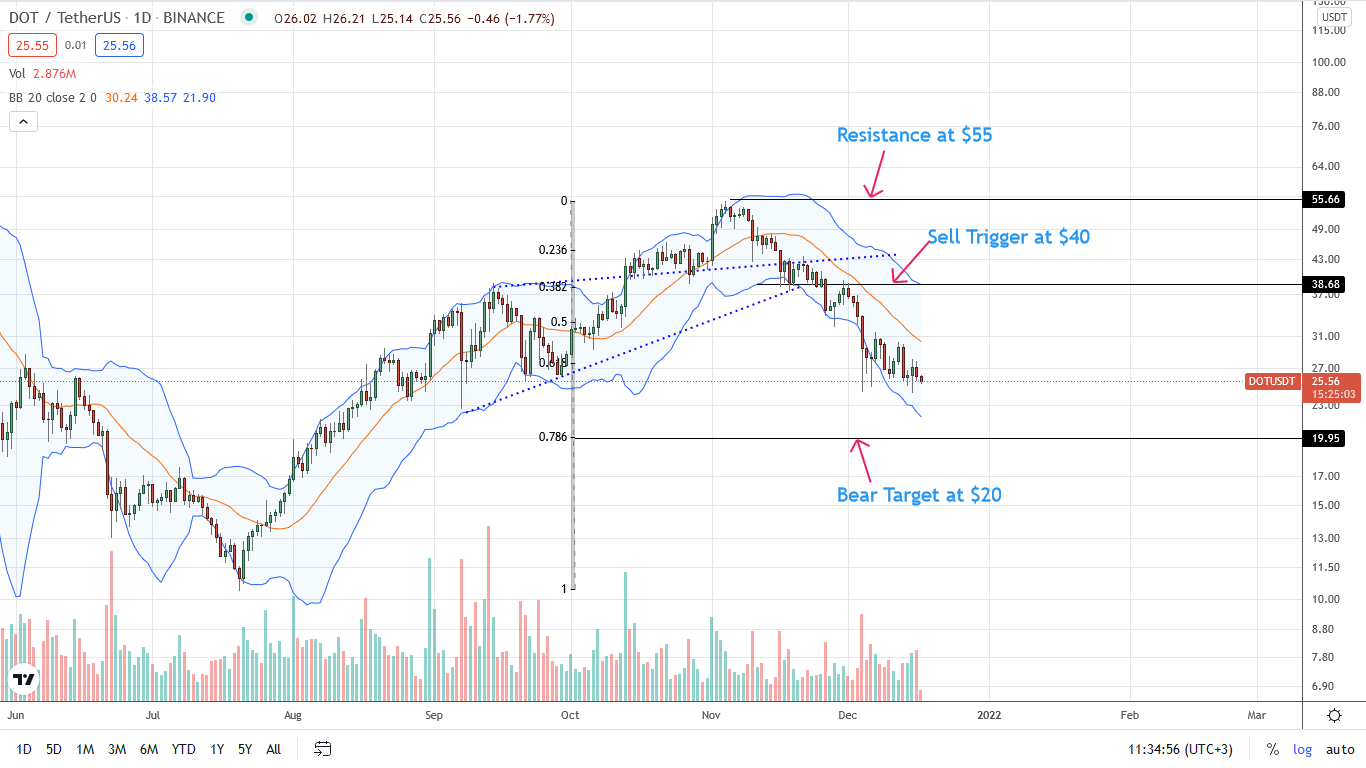
Overall, DOT crypto prices are diving, sliding following losses in mid-November, worsened by sellers of December 4.
Even though Polkadot has sound fundamentals, the DOT coin may dump to $20.
Notably, the primary support is $24—the December 4 lows.
If DOT crypto buyers lose this floor, it may highly likely dump to $20 in continuation of the bear breakout pattern of November 27.
Kava
The cross-chain money market uses KAVA as the primary currency, governing its stablecoin.
Past Performance of KAVA
The KAVA token is outperforming most crypto assets reading from the price performance in the daily chart. From the KAVA technical analysis, prices are bouncing after sinking over 65 percent from 2021 peaks.
Day-Ahead and what to Expect
From the KAVA crypto candlestick arrangement, there are elements of strength.
It is yet to be defined since sellers are rampant and dominating.
All the same, the reaction at $3—December 4 lows—might re-injecting momentum, helping KAVA coin cope up with the strong selling pressure of the past few weeks.
KAVA Technical Analysis
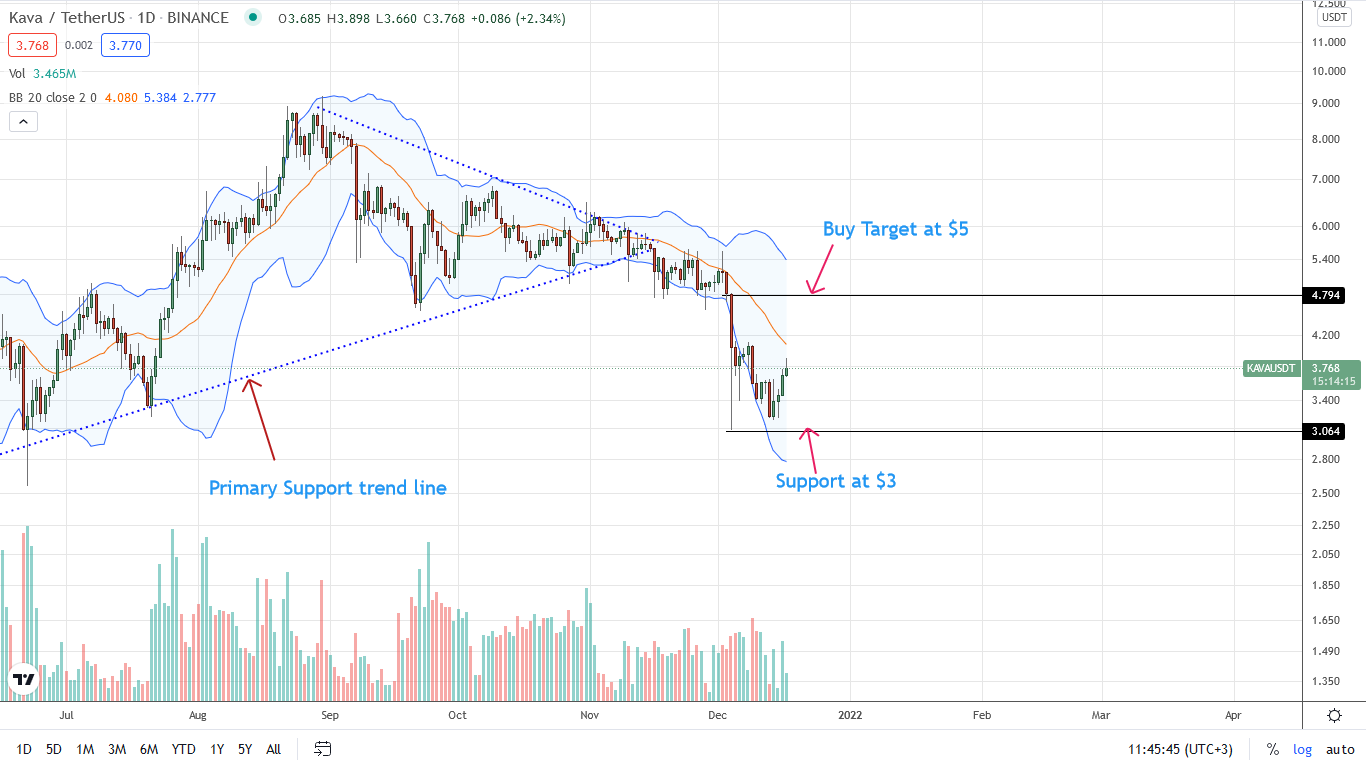
KAVAUSDT is within a bear breakout pattern, clear from the daily chart.
As mentioned earlier, the recovery from December 4 lows at $3 is a net positive for prices.
For the uptrend to be valid, KAVA token buyers must double down and print above $4.5—piercing above the middle BB.
This may be the base for a lift-off towards $5—around the trading range defined by losses of early December 2021.
On the flip side, if sellers flow back, losses below $3 may force KAVA to H1 2021 lows at around $2.