The sudden reversal in the IOTA coin price after the 10% fall brings huge bullish attention that can drive the prices to the $1.50 mark.
IOTA is a distributed ledger having one important distinction that it's not actually an actual blockchain. Instead, its own technology is referred to as Tangle, a network of nodes that verify transactions.
The platform's foundation claims that it offers much faster speed than standard blockchains and is a perfect place to establish a footprint for the rapidly expanding Internet of Things ecosystem.
Read more to know more about the technical analysis of the IOTA token.
Past Performance of IOTA
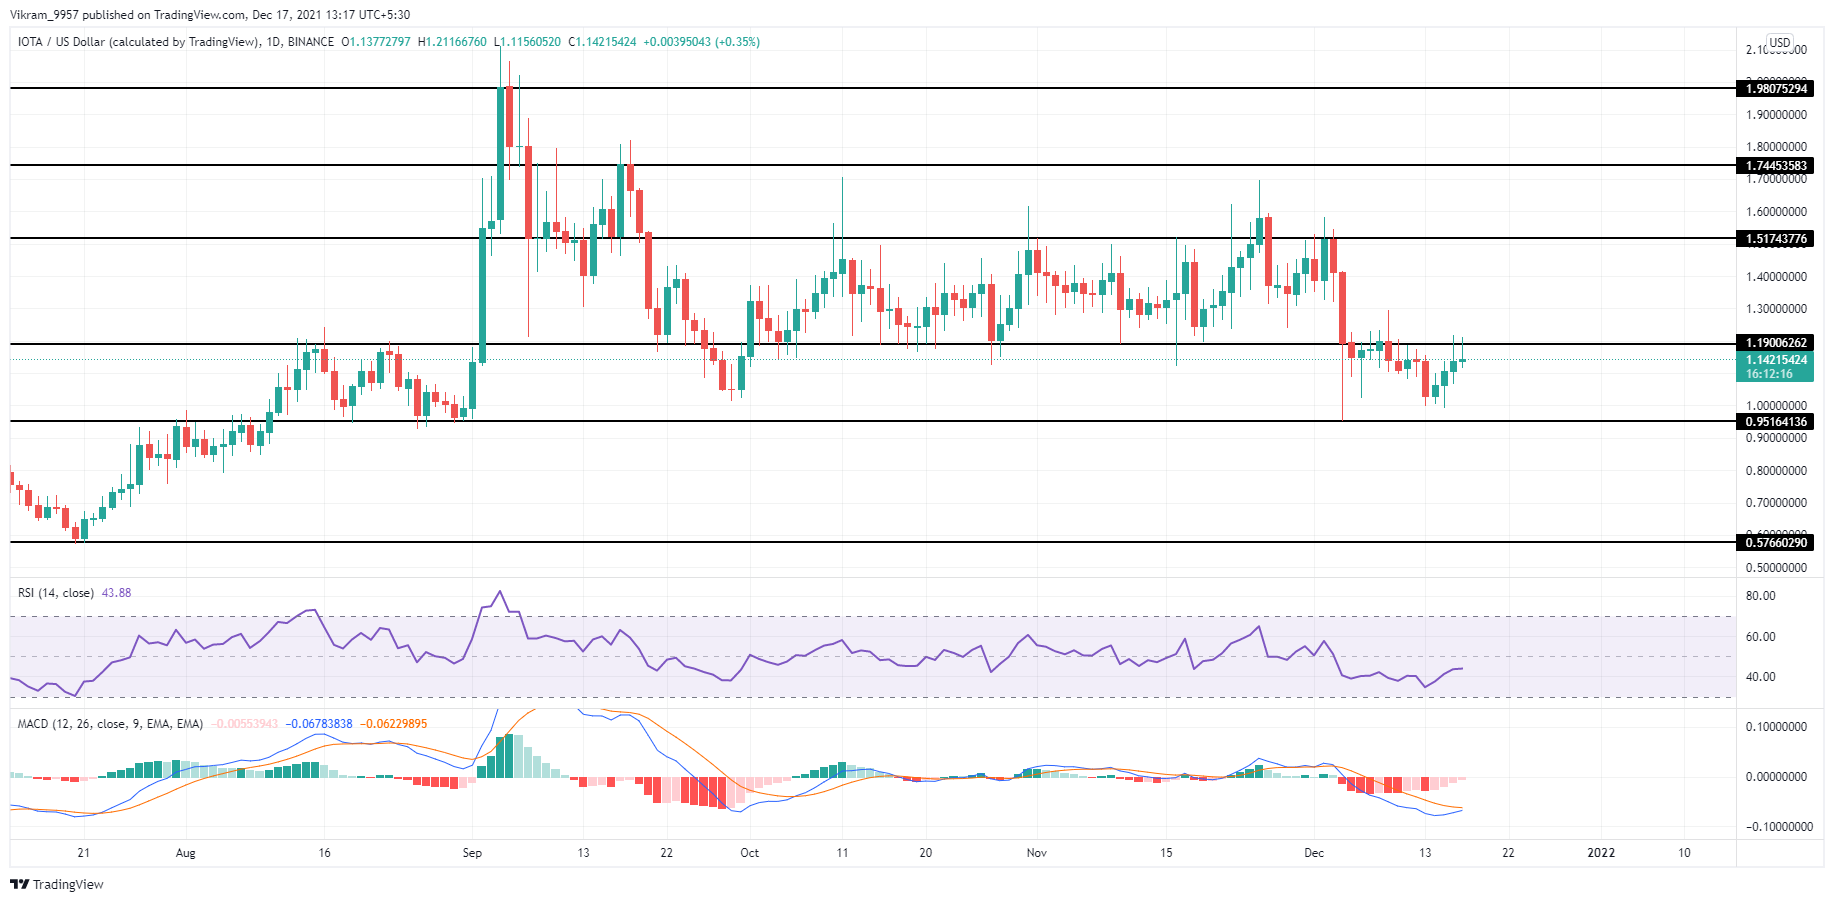
The IOTA coin price maintains a range between $1.01 and $1.20 in the last week. However, the coin shows multiple bullish candlesticks to recover from the 10% fall on December 13.
The fall in the intraday trading volume of 15% shows and the 16% fall in market cap in the past month shows the price is under bearish clouds.
IOTA/USD 4-hour Chart
IOTA Technical Analysis
With the price higher towards the $1.20 resistance mark, a breakout entry opportunity awaits for bullish traders. The IOTA coin price can show a 25% to 45% jump upon breakout to the $1.5 or $1.75 marks.
Moreover, the recent V-shaped recovery attracts more price action traders ready to enter at the $1.20 breakout.
The crucial EMAs - 50, 100, and 200 in the daily chart maintain a bearish alignment. Meanwhile, the 50 days EMA gives a bearish crossover with the 100 days EMA. Moreover, the price remains below the 200 days EMA that can act as a dynamic resistance.
The RSI indicator at 42% shows a sudden spike in the slope from the 34% in the daily chart. Furthermore, the MACD indicator in the daily chart shows a rise in the fast line, which may soon cross above the seller's line. Thus, giving a bullish crossover.
Upcoming Trend
Currently, the IOTA coin price sustains below the $1.20 mark, with further resistance at the $1.50 mark. However, the technical indicators showcase a rise in underlying bullishness that may overcome the dynamic resistance of the EMAs.
Therefore, traders can expect a bull run of 25% to 45% in the upcoming weeks, making a bullish start of 2022.