- Chainlink saw a lot of buying pressure over the past five days following a nice recovery from the critical support level.
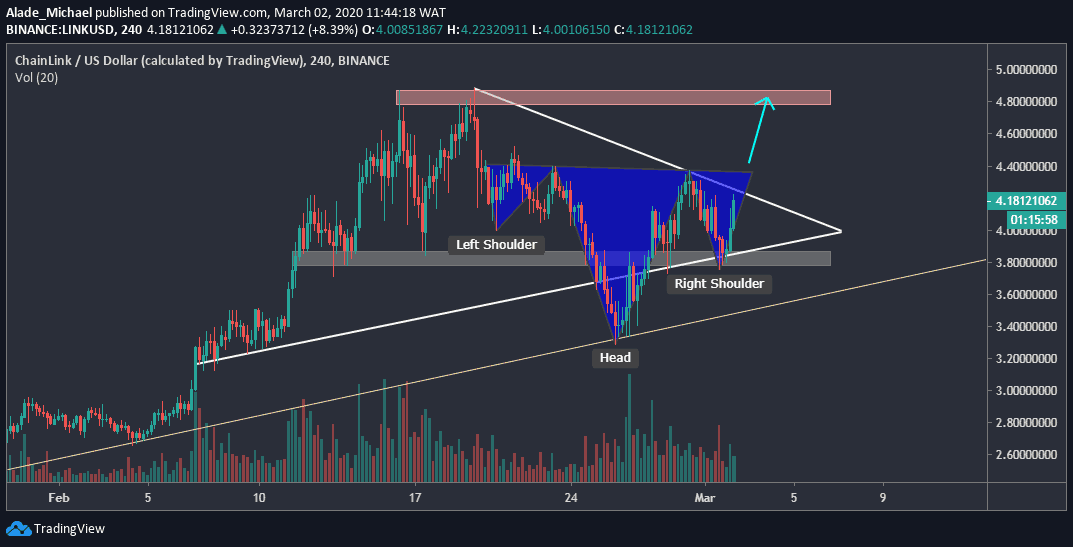
- The LINK/USD pair is attempting to break out from a symmetrical triangle with a bullish head-and-shoulder pattern.
- A new bullish swing may start at 0.00045BTC level if buyers show strong commitment.
LINK/USD: Chainlink Looking For Break Confirmation To Start New Bullish Rally
Key Resistance Levels: $4.4, $4.8
Key Support Levels: $3.8, $3.3
Following Bitcoin’s crash over the past two weeks, most altcoins experienced big losses, including Chainlink. But today, Link is up by 2.66% after seeing a five-day recovery from $3.3. This price increase might lead to a triangle break up if Link continues to gain momentum.
More so, the price is close to $4.4 resistance to complete an inverse head-and-shoulder pattern, marked blue on the 4-hours chart. A clean break at the neckline ($4.4) should confirm a new bullish rally for Chainlink.
Link is now the 11th most-traded coin by market cap with $454.6 million trading volume. The latest gains have made Link to trade at $4.12 against the US Dollar.
While Chainlink is currently supported by $3.8, the last five days bounce was similarly footed from the yellow trend line. As long as buyers continue to show interest, more price growth should be expected in the next few days
Chainlink Price Analysis
Chainlink is forming a bullish pattern on the 4-hours, but this setup is yet to be confirmed. There’s a need for a breakout at $4.4 resistance before the validation of a bullish trend.
A successful break should send Link straight to the red resistance area of $4.8. In case the symmetrical triangle continues to trap buying pressure, we may see a slight drop back to $3.8 support.
If Chainlink fails to hold at this grey support area (the right shoulder), the next level to watch out for is the $3.3 – where the head lies. This would only happen if the price significantly breaks below the rising yellow line. As it is now, the bulls are in play.
LINK/BTC: Link Charges Again After Establishing Weekly Low Around 0.00045BTC Level
Key Resistance Levels: 0.00050BTC, 0.00055BTC
Key Support Levels: 0.00045BTC, 0.00037BTC
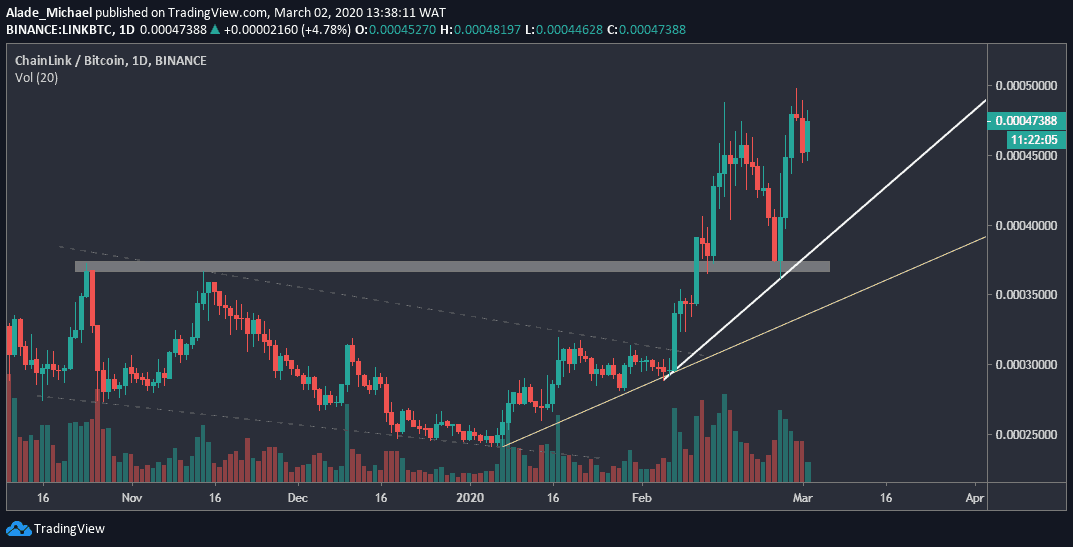
Against Bitcoin, Chainlink has seen a lot of growth over the past weeks following a fast-recovery from February 26 low of 0.00037BTC level. This rebound made Chainlink to almost hit a psychological level of 0.00050BTC over the weekend before rejecting to 0.00045BTC level yesterday.
From here, we have seen a long opening to 0.000475BTC level today, although the price is down by 1% at the moment. If Chainlink continues to rise, small support might establish around 0.00045BTC.
However, LINK/BTC pair is currently supported by a white rising trend line, followed by the yellow one that is forming since January. If Chainlink tries to break beneath this diagonal support lines, we may start to consider a long-term bearish. But as it stands now, the bulls appeared to have gained control of the market.
Chainlink Price Analysis
Today, Link has shown a little strength after witnessing a two days fall. If the price keeps growing, a close resistance is located at 0.00050BTC levels. An increase above this resistance should propel buying to 0.00055BTC resistance in no time.
An inverse move could cause another panic selling in the market. In that case, the primary support to watch is 0.0045BTC – yesterday low. The next major support lies in the grey area of 0.00037BTC, right below the white rising trend line.
As said earlier, if Link further drives beneath the yellow ascending line, a strong bearish momentum would be confirmed.