Bitcoin (BTC) price has been testing the $10,000 mark this month as online metrics like the number of tweets and Google searches mentioning Bitcoin show a two year-high.
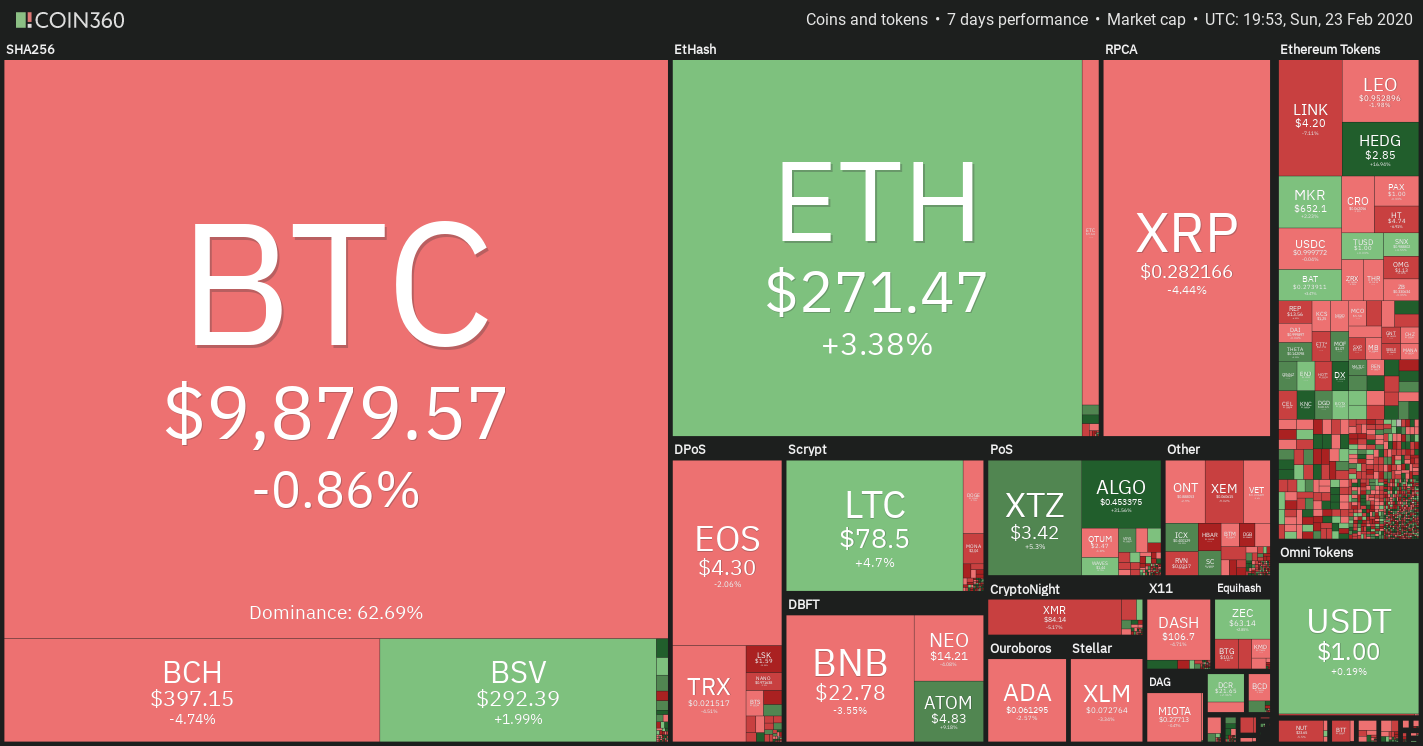
Cryptocurrency market weekly overview. Source: Coin360
Several relationships have been established between external factors and Bitcoin price evolution. Most notably, social media metrics like the number of tweets mentioning a particular cryptocurrency, the number of comments or posts in a cryptocurrency dedicated subreddit, the number of daily search volume for a specific crypto theme, or even the mentions of “Lambos” on Reddit.
Sentiment analysis from this kind of data can help investors attempting to predict returns, thus making it a novel approach for traditional investors.
Analyzing tweets and Bitcoin price from 2017 to 2019
Looking at the daily number of tweets mentioning Bitcoin since 2017, there is a clear spike during the 2017 bull-run. On Dec. 7, 2017, there was a record-high of 155,600 tweets mentioning Bitcoin. Following that spike, throughout 2018 and 2019 the average number of tweets reduced substantially, although there was a small spike on June 26 during the peak of Bitcoin’s smaller bull run in 2019.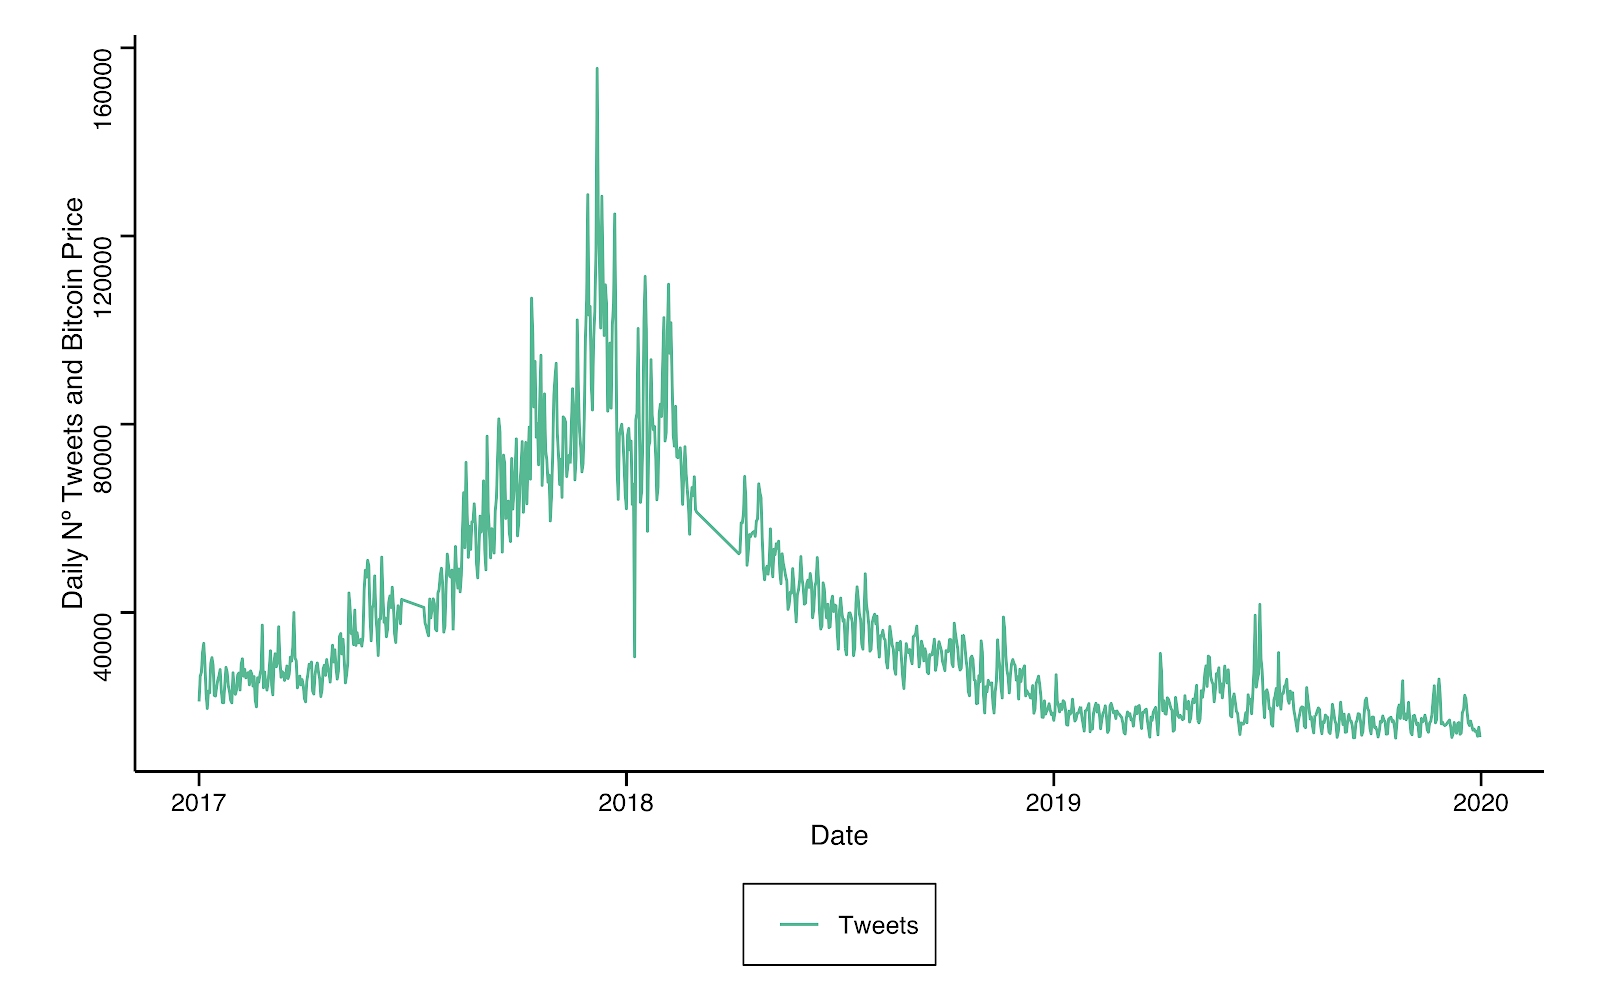
Number of daily tweets from January 2017-December 2019.
This medium-term trend between the number of tweets and Bitcoin price may suggest that both variables are related or that one can be a predictor of the other. As expected, throughout 2017 the correlation between price and the number of tweets is the highest across the years at 0.86.
A correlation of 1 means that Bitcoin and the number of tweets are fully positively correlated, while — 1 means they are fully inversely correlated. Additionally, a correlation of 0 means they are not correlated in any way.
Even though 2018 was a bear period, the same high relationship between price and tweets remains with a correlation of 0.74. This relationship is much lower in 2019 (0.12) even though Bitcoin showed a great gain in price between March and June.
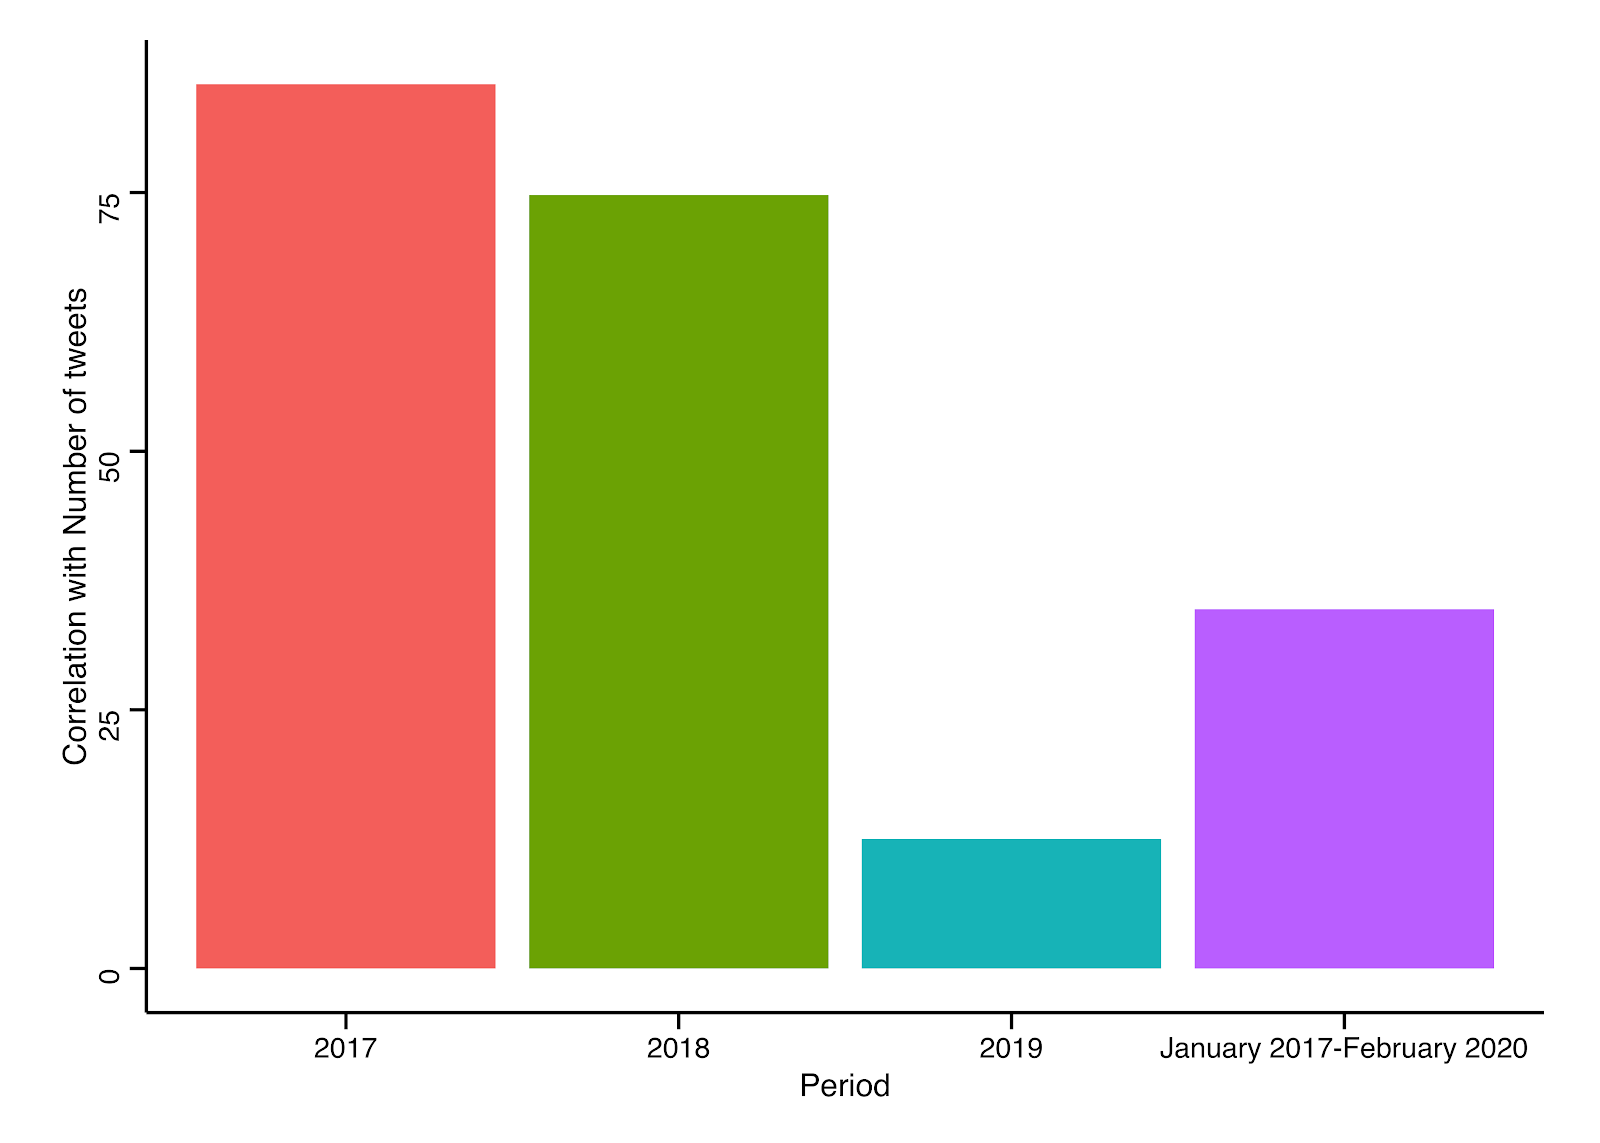
Correlation between Bitcoin price and the number of daily tweets.
Tweets as a predictor of Bitcoin’s volume
High correlation values may tempt enthusiasts to assume that the number of tweets can work as a reliable predictor of Bitcoin’s future prices. However, by employing year-on-year analysis, we find significant results between the number of tweets and volume — a key intake for investors to incorporate these social metrics into their technical analysis.
When it comes to the influence of tweets on Bitcoin’s volume, the relationship during 2017 is stronger than in 2018 or 2019 and significant across the years. In 2017, if the number of tweets increased by 1%, we could assume a higher probability that Bitcoin’s volume would increase by 2.6% on the same day. This relationship holds for the other years but the increase in volume is below 1% in both 2018 and 2019.
By analyzing the future power of tweets to predict next day’s volume, we find similar significant results with similar magnitude, meaning, when today’s number of tweets increase by 1%, Bitcoin’s volume increases the same day by 2.5% in 2017, 0.64% in 2018 and by 0.72% in 2019.
Do tweets accurately predict Bitcoin returns?
The holy grail of any financial market would be the ability to predict future returns. Across the years, we’ve not seen any significant results between the number of tweets and Bitcoin returns. Unless one counts 2019 when the number of tweets increased by 1%, returns would increase by 0.036% on the same day. When trying to establish a relationship between the number of tweets and future Bitcoin returns, we find no significant results, hence we cannot establish the same conclusion as we did regarding volume.
A recent outlook on this relationship
Since the start of the year, Bitcoin has seen tremendous growth resulting in a 27% return for crypto hedge funds in January, the highest performance seen since 2017. This data point aligns with altcoins which are following an even greater positive trend. It also leaves the door open to further research into whether social trends previously observed actually impact crypto trading volume. It would be useful to reconfirm whether or not the start of 2020 shares similar characteristics to the bullish periods in 2017 or 2019.
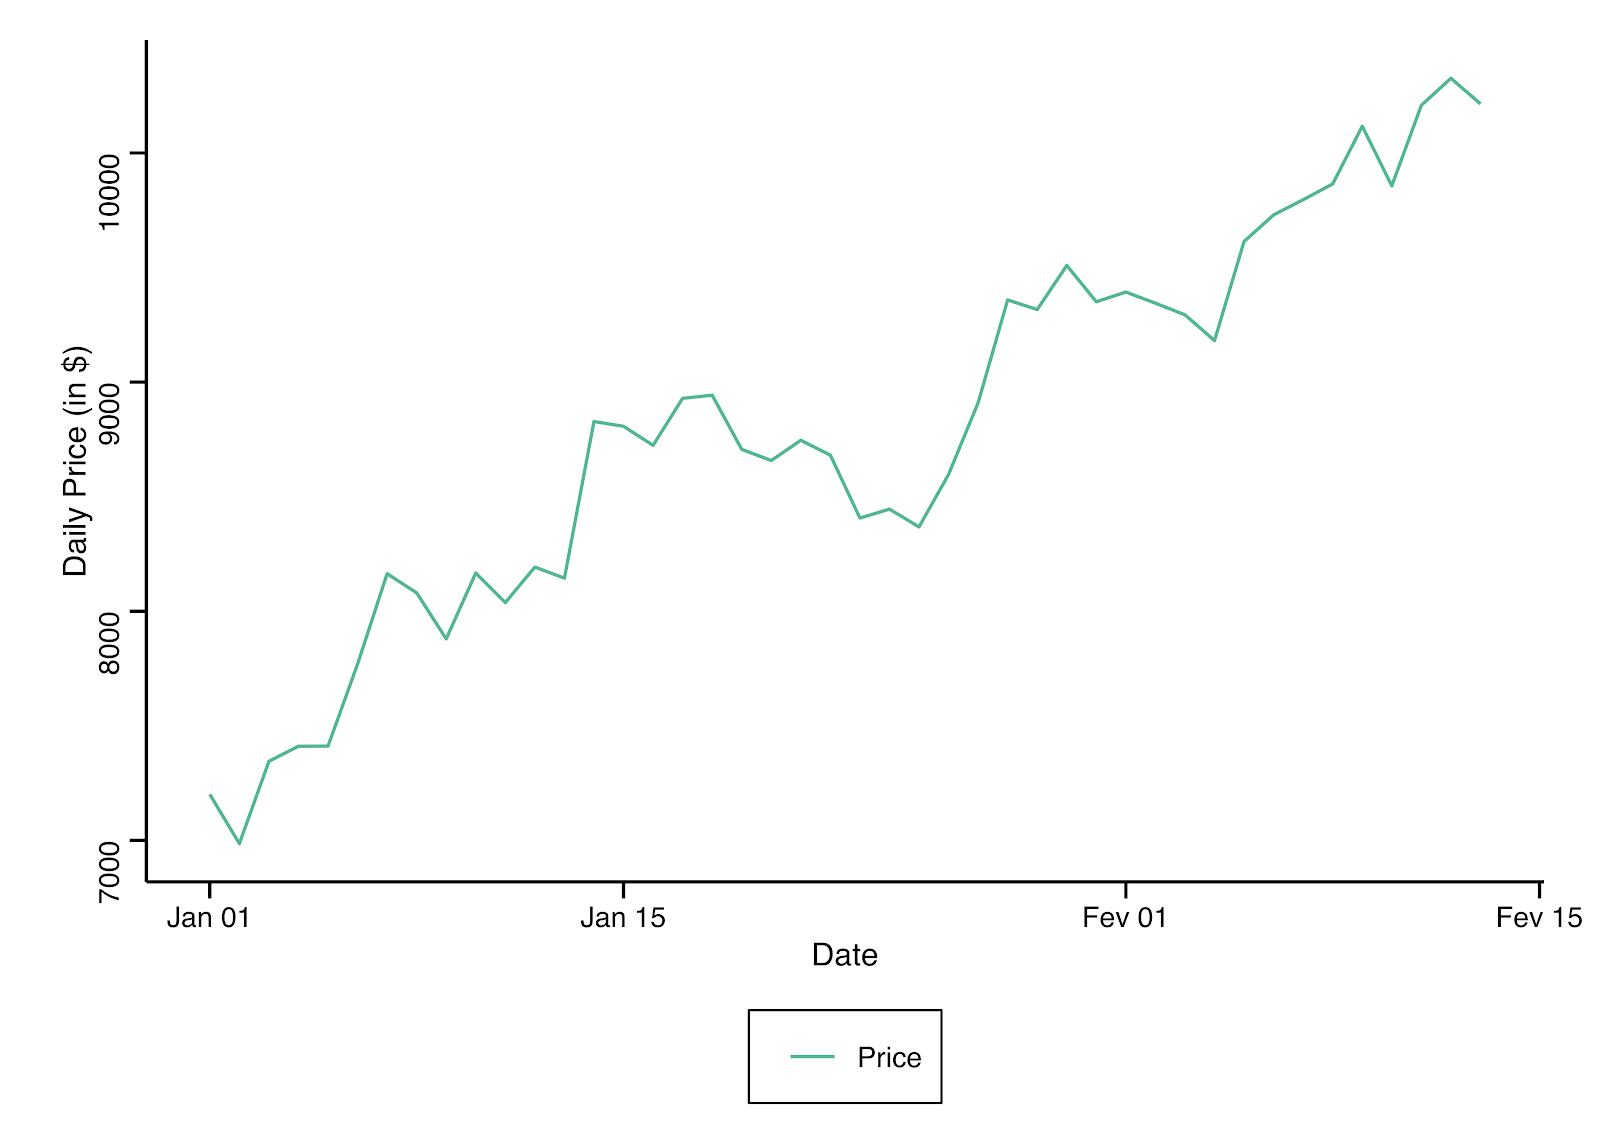
Bitcoin daily price from Jan.1, 2020-Feb.13, 2020.
When it comes to the average number of tweets mentioning Bitcoin in January and February this year, there has been an increase from the average observed during 2019 - from a daily average of 18,972 tweets in 2019 to an average of 22,070 tweets in the start of 2020. Besides that, an abnormal spike in the number of tweets happened on Feb.2, increasing the average number of tweets this February (31,945 tweets) in comparison to January (17,929 tweets).
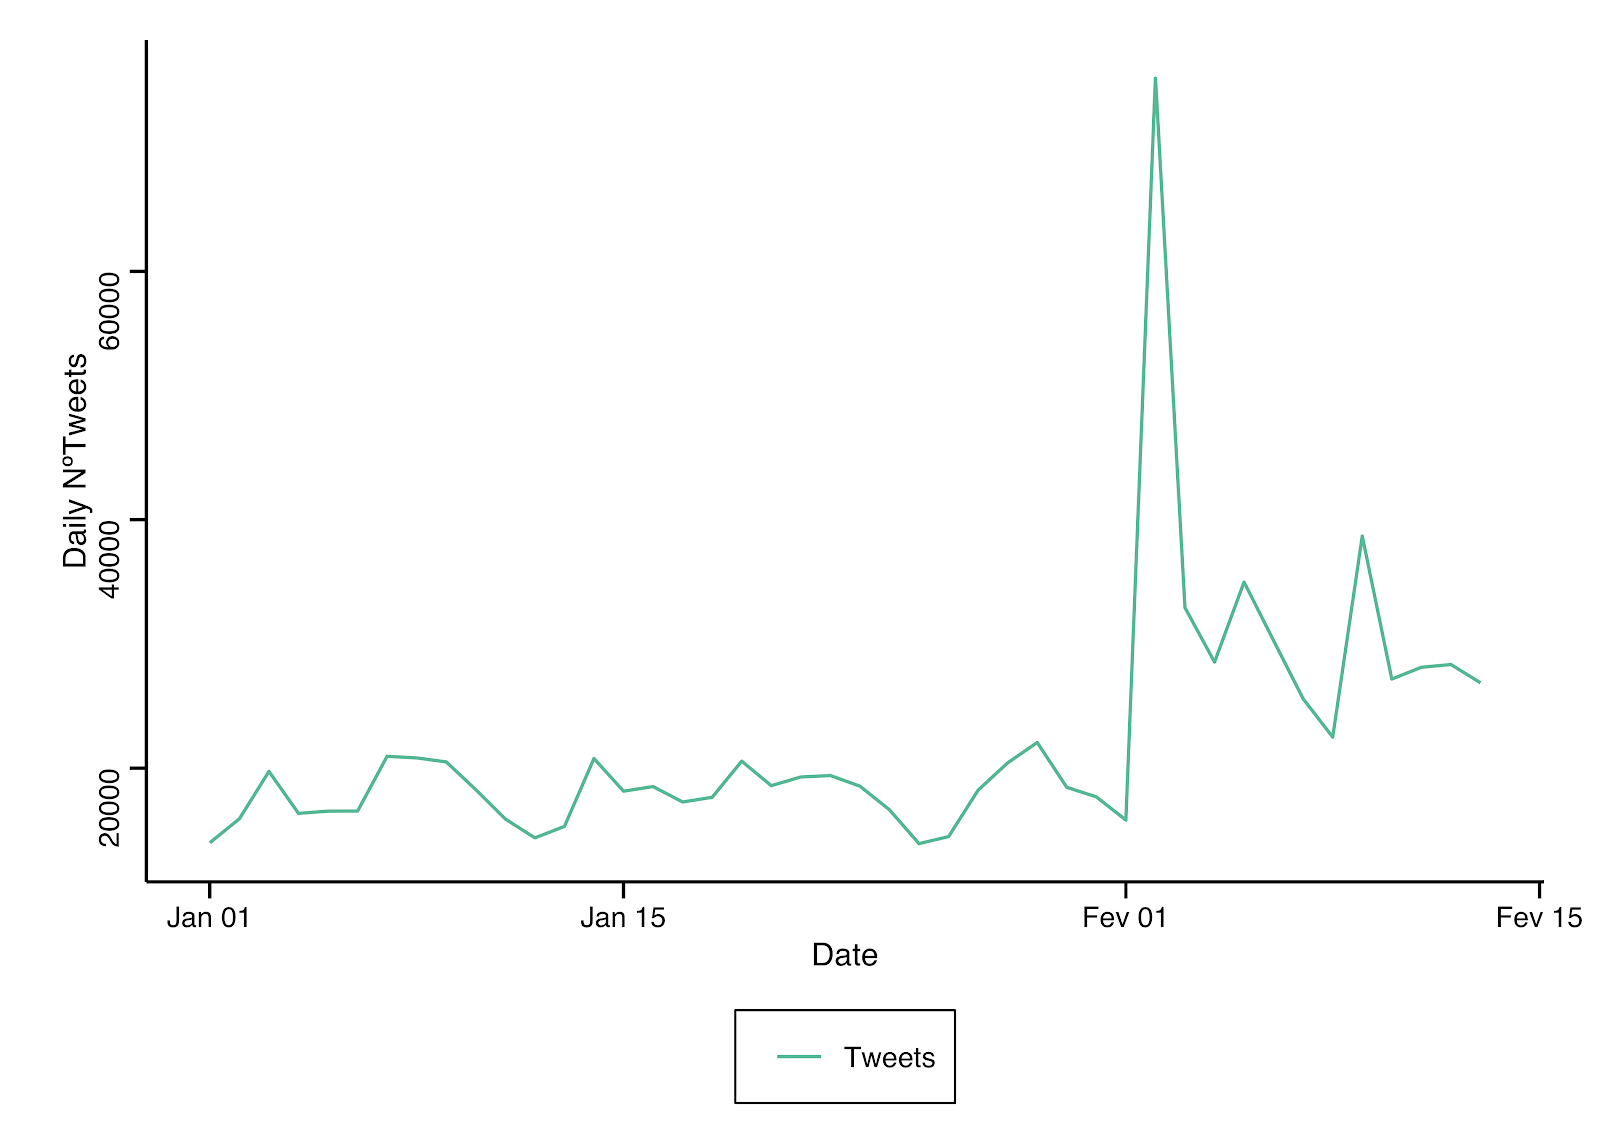
The number of daily tweets from Jan.1, 2020-Feb.13, 2020.
Following this trend, we find that the relationship established between the number of tweets and volume is also observable in the first month and half of 2020. However, the magnitude of the impact that the number of tweets causes in volume is less than in other years.
When the number of tweets increases by 1%, volume increases by 0.423% on the same day. The impact is slightly smaller when looking at the predicting power of the number of tweets. When these increase by 1% today, the volume will increase by 0.44% the next day.
Looking forward, investors can incorporate the influence of the number of tweets into their analysis as the movement in transaction volume occurs consistently throughout the years. All of this is worth some consideration as many analysts have suggested that a new bull trend is taking shape in the crypto market.
Therefore, looking at social metrics spikes like tweets can complement investors’ ability to determine periods of speculation so they can adjust their investment strategies accordingly.
Data for the number of tweets drawn from https://bitinfocharts.com. The views and opinions expressed here are solely those of the author and do not necessarily reflect the views of Cointelegraph. Every investment and trading move involves risk. You should conduct your own research when making a decision.
 cointelegraph.com