- Chainlink has seen a strong 52% price increase over the past fortnight as it reaches $4.29.
- The cryptocurrency was unable to overcome the 2019 high at $4.81, causing it to roll over and fall by around 10% this week.
- Against Bitcoin, LINK has been clocking fresh ATH’s as it reaches as high as 0.00049 BTC
Key Support & Resistance Levels
LINK/USD:
Support: $4.81, $5.00, $5.43.
Resistance: $4.14, $3.75, $3.21.
LINK/BTC:
Support: 0.000428 BTC, 0.000392 BTC, and 0.000367 BTC.
Resistance: 0.00046 BTC, 0.00049 BTC, 0.0005 BTC.
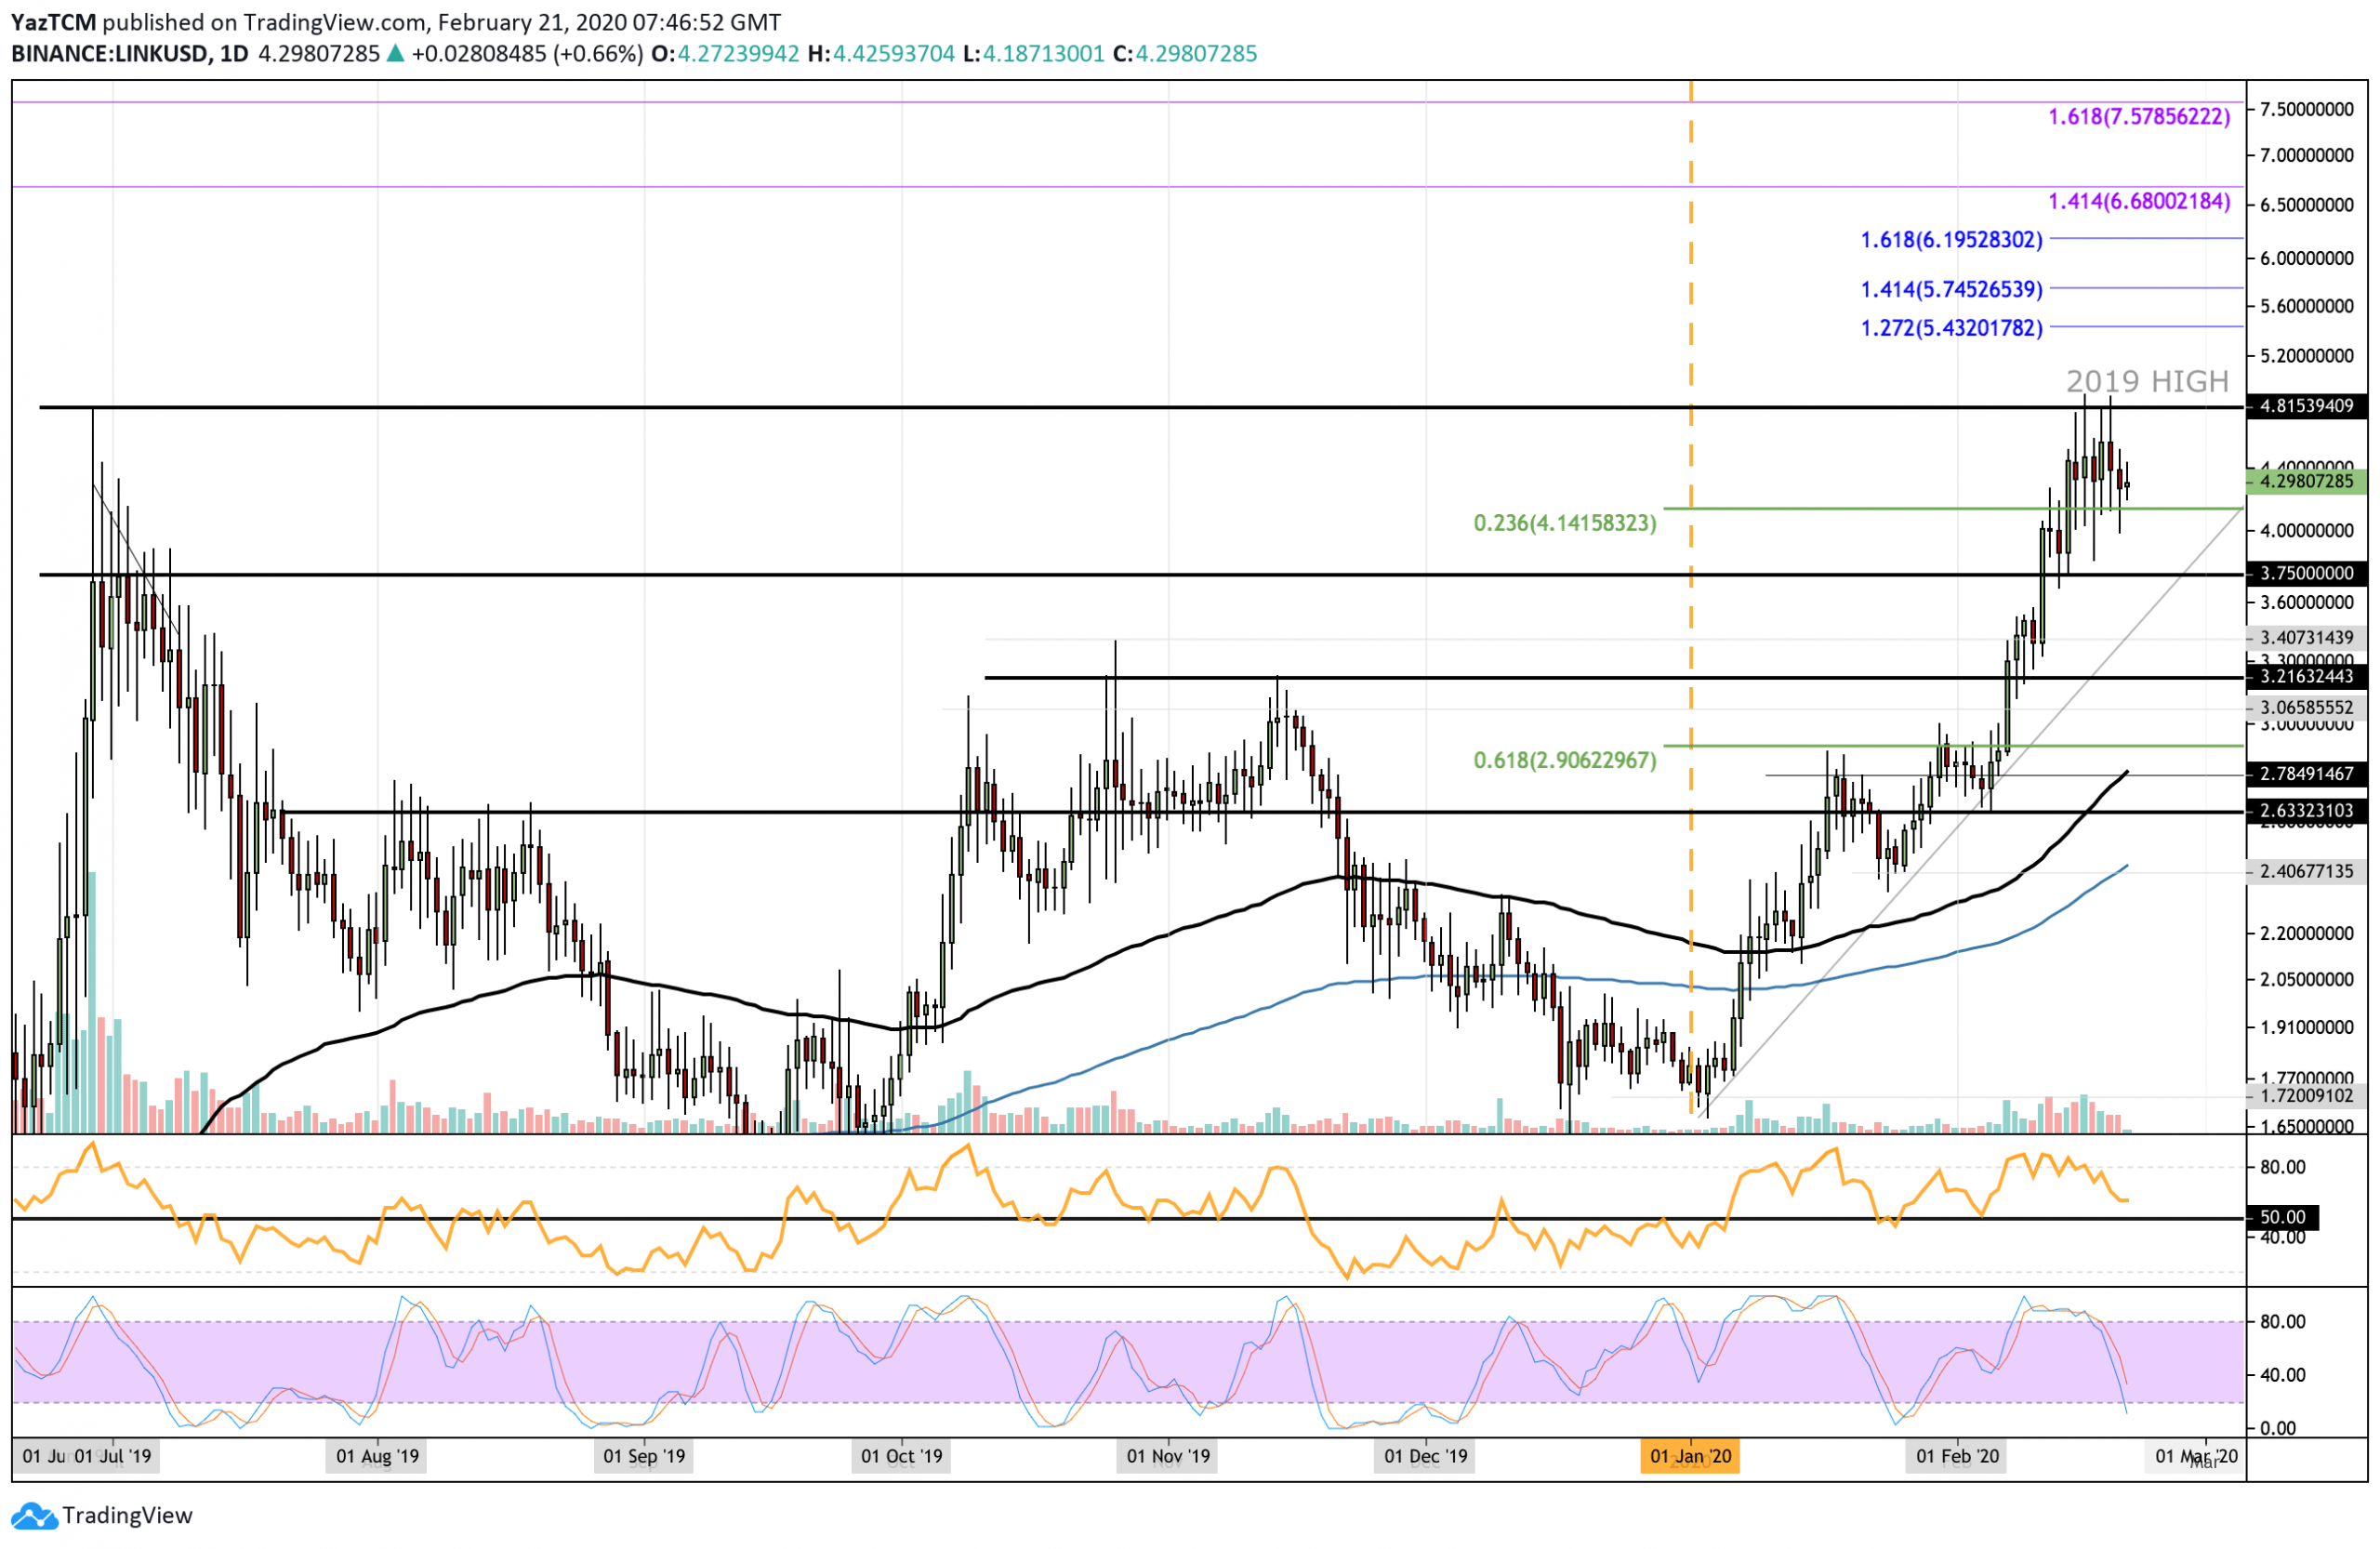
LINK/USD: LINK Fails To Break 2019 Price High
Analyzing the daily chart, we can see LINK rebounding from $1.72 at the start of the year and going on to climb by a total of 180% to reach the 2019 high at $4.81.
It attempted to break above 2019’s high but has been unsuccessful thus far. On the retracement, LINK has managed to find strong support at the short term .236 Fibonacci Retracement level at $4.14.
The coin remains bullish and would need to drop beneath the support at $3.20 for this bull run to be invalidated.
LINK Short Term Price Prediction
If the buyers regroup and start to push higher, the first level of resistance lies at $4.81 (2019 high). If they break $5.00, additional resistance lies at $5.43 (1.272 fib Extension), $5.74 (1.414 Fib Extension), and $6.00.
On the other side, if the sellers break $4.14, support lies at $4.00. Beneath this, additional support lies at $3.75, $3.40, and $3.21.
The RSI is above the 50 level to show that the bulls remain in control of the momentum. The Stochastic RSI needs to produce a bullish crossover signal before the next push higher to provide additional momentum to break last year’s high.
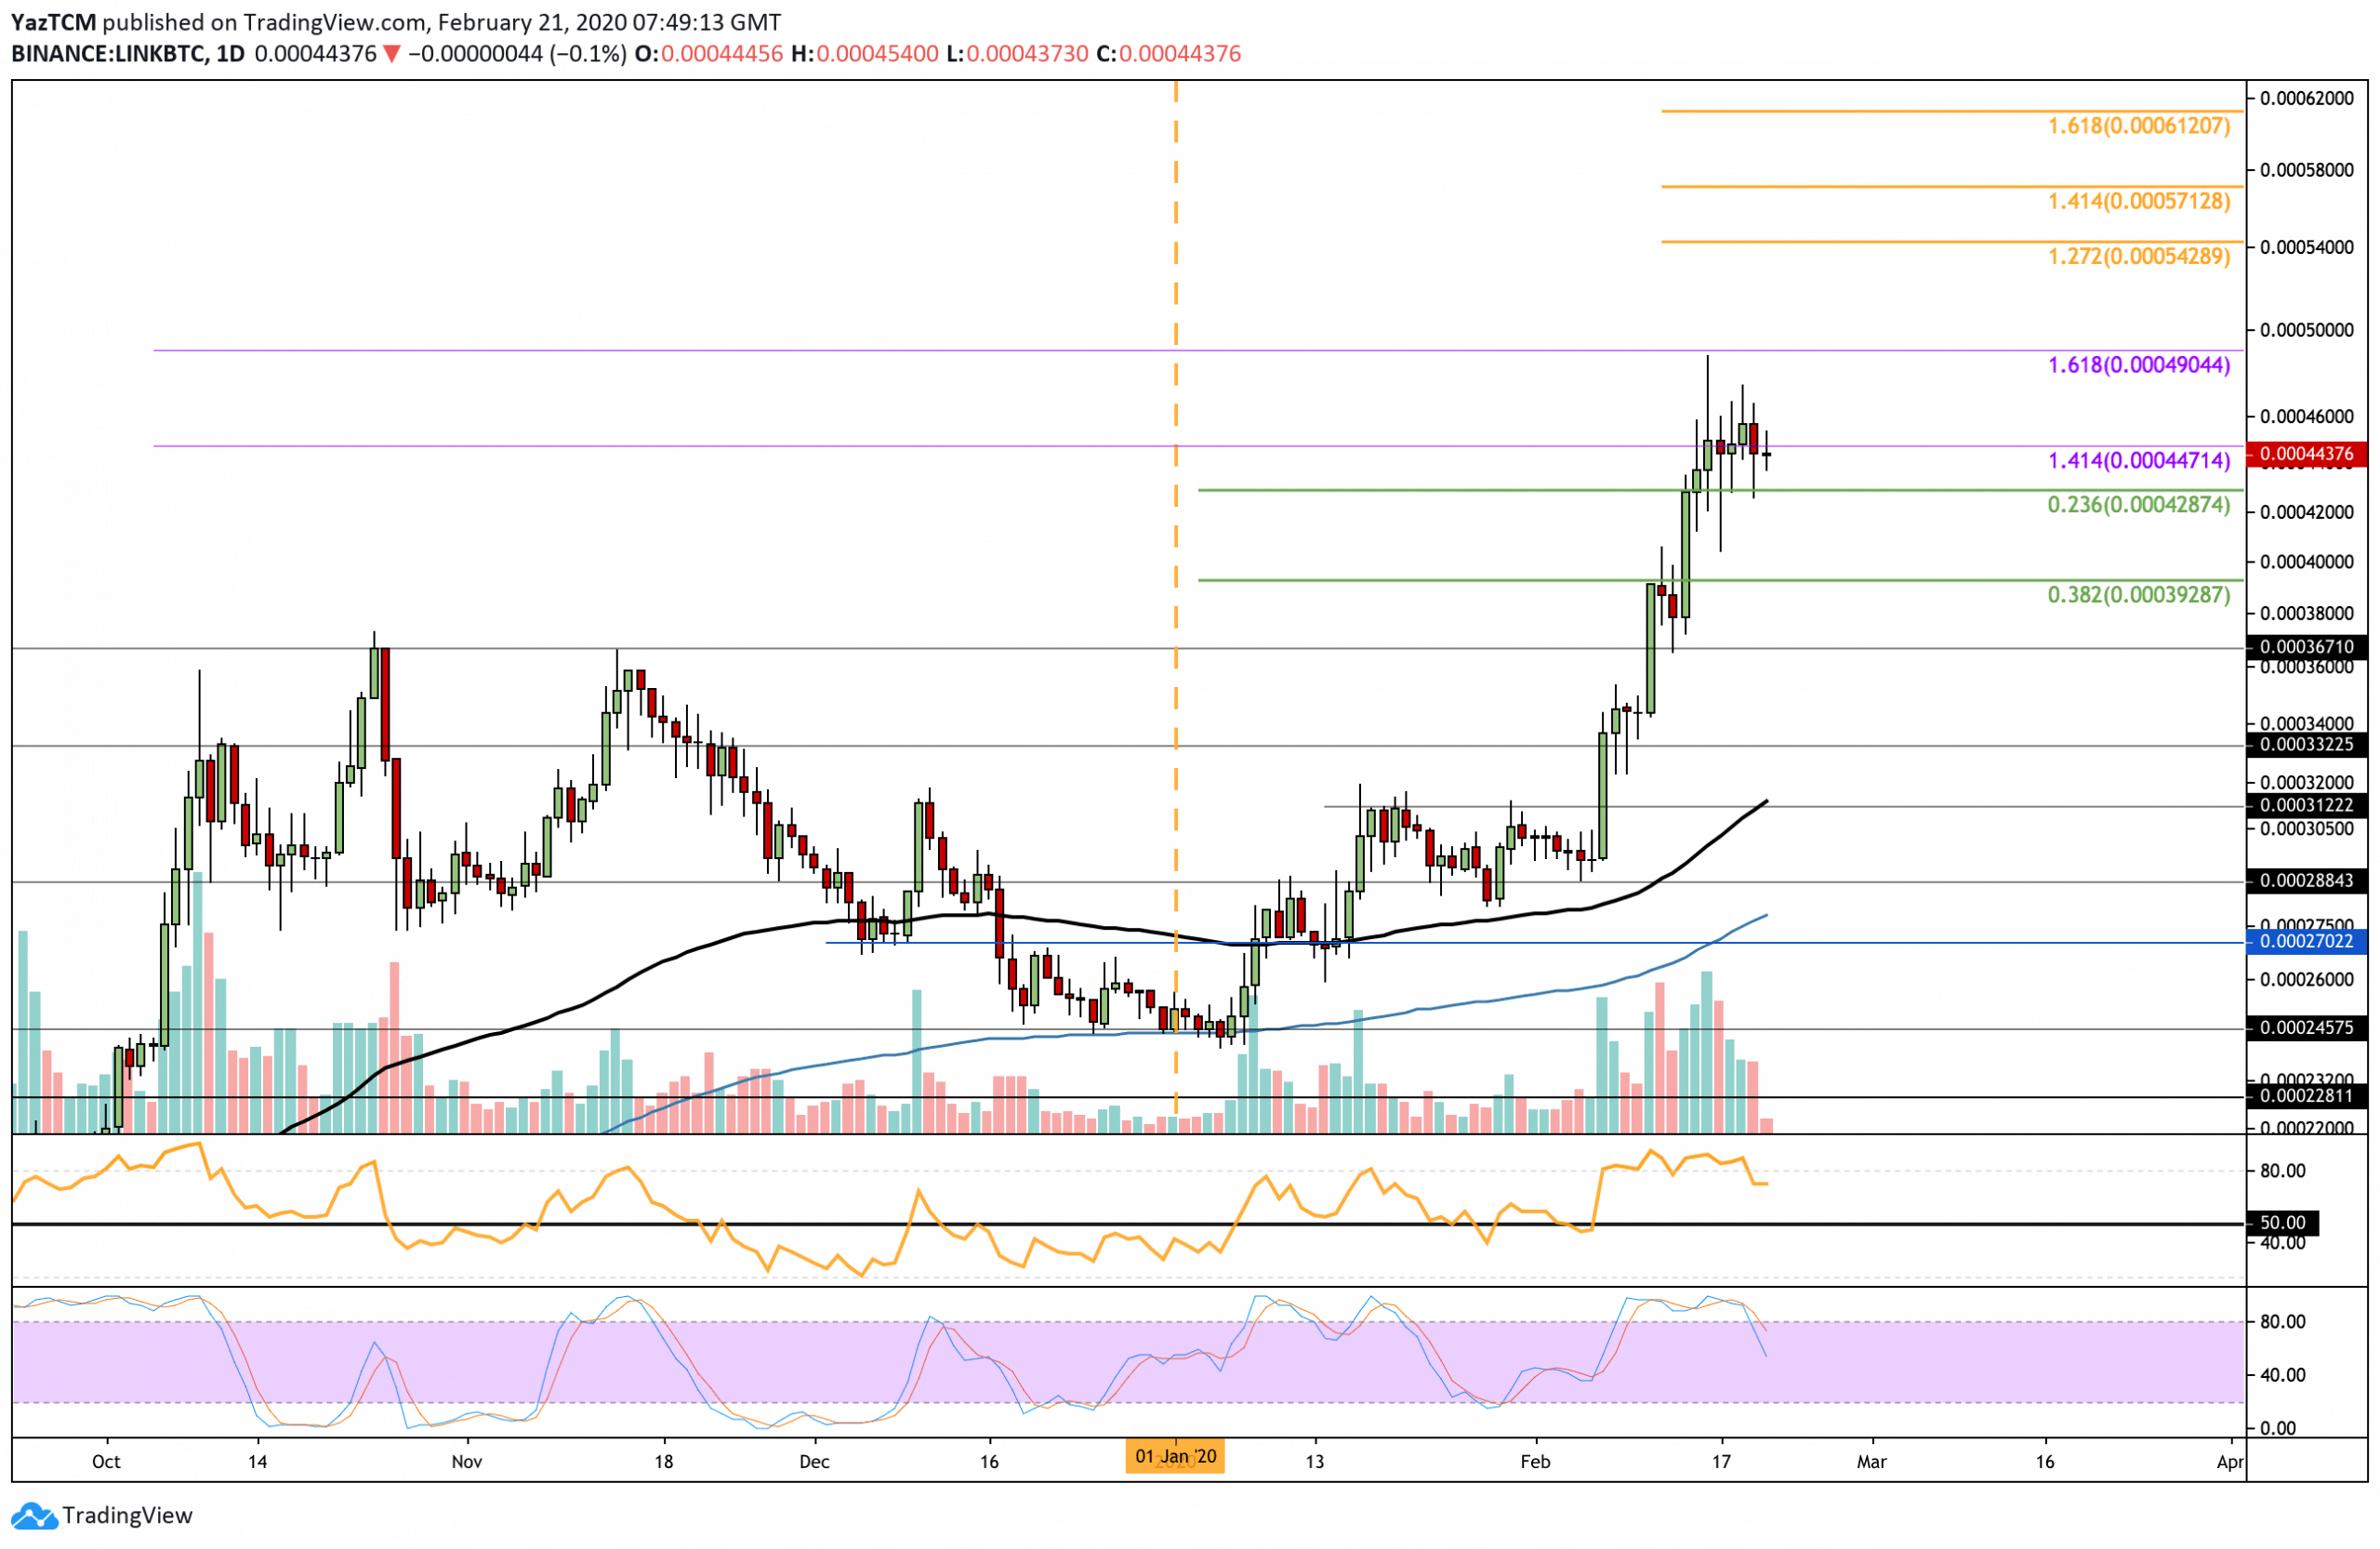
LINK/BTC: LINK Creates Fresh ATH Against BTC
Against Bitcoin, LINK has been creating fresh all-time highs this year. It broke above the previous ATH at 0.000367 BTC during February and continued to climb further higher to reach a new ATH at 0.00049, provided by a 1.618 Fib Extension level.
It has since dropped slightly as it trades at 0.00044 BTC but remains strongly bullish at this moment in time.
LINK Short Term Price Prediction
If the sellers push lower, the first level of support is expected at 0.000428 BTC (.236 Fib Retracement). Beneath this, additional support lies at 0.000392 BTC (.382 Fib Retracement), and 0.000367 BTC.
On the other hand, if the buyers break above 0.00046 BTC and push higher, the first level of resistance lies at 0.00049 BTC (long term 1.618 Fib Extension). If they break above 0.0005 BTC, higher resistance lies at 0.00054 BTC (1.272 Fib Extension).
The RSI is above the 50 level to show bullish momentum. However, the Stochastic RSI recently produced a bearish crossover signal, which could be a sign that the bullish momentum could be fading.