- Polkadot price analysis is bearish today.
- Resistance for DOT/USD is present at $29.8.
- Support for DOT/USD is present at $27.1.
The Polkadot price analysis is in a bearish direction today. The bears have been dominating as the price has again decreased to $29. The bearish trend had cast quite negative effects on the cryptocurrency’s value as the larger trend has been bearish for a long time. Yesterday bulls have taken a step to counter the loss, but bears have taken the lead back again today. Further degradation in price is also expected.
DOT/USD 1-day price chart: Bears leading the price function
The 1-day price chart for Polkadot price analysis shows bears are leading the charts for today as the bears have been able to make a breakthrough after the bullish trend of yesterday, and as a result, the price is going down again, and the coin is trading at $29.11 at the time of writing. The bearish trend has been strengthening for the past few weeks, and the moving average (MA) has come down to $32.
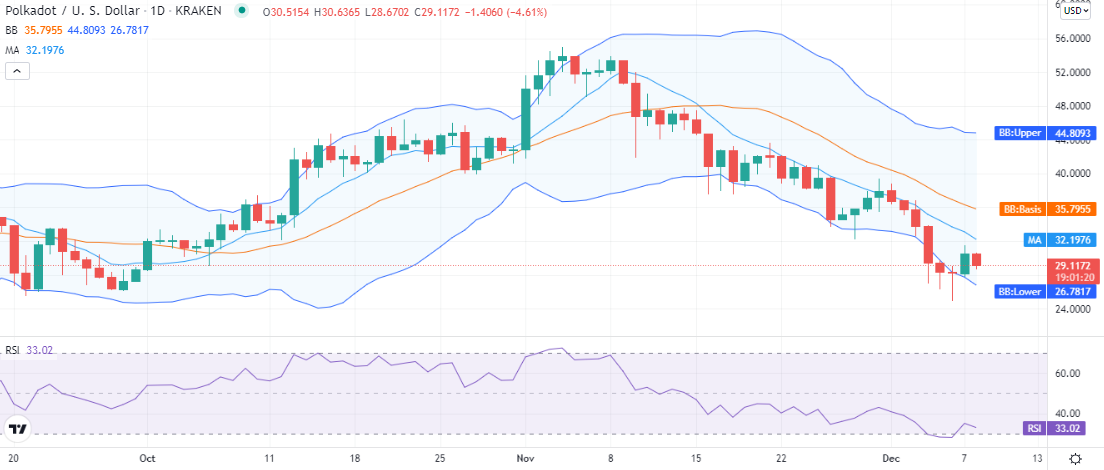
The Bollinger bands show high volatility as they expand and cover more areas. The upper band has reached $44.8, and the lower band has reached $26 representing support for DOT. The average of the Bollinger bands is present at $35 above the MA value due to the constant bearish trend. The relative strength index (RSI) shows a downwards slope as it is trading near the border of the oversold region at index 33. The RSI shows the DOT is in high bearish pressure and hasn’t found the support to break out of it.
Polkadot price analysis: Recent developments and further technical indications
The 4-hour price chart for Polkadot price analysis shows the bulls are putting their efforts to elevate the price recently. After the price breaking downwards today, the bears plunged it down to $28.8, but the coin rejected further downside, and the price has returned to $29.11 lastly.
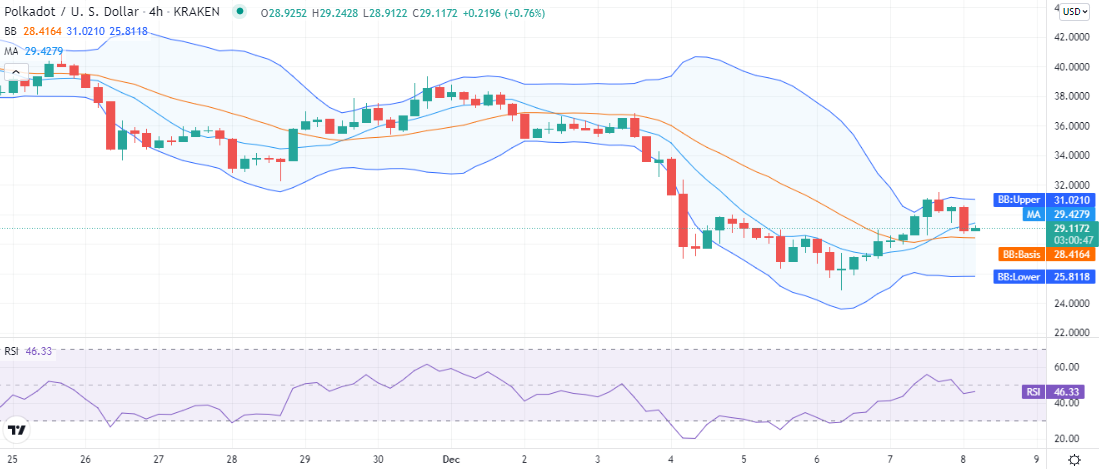
The volatility is comparatively mild on the 4-hour chart as the Bollinger bands now show a narrow channel for the price to function after converging sharply on 7th November. The upper band is present at the $31 mark representing resistance for DOT, and the lower band is present at the $25.8 mark. The average of the Bollinger bands is present at the $28 mark representing support for DOT/USD. The RSI is now on a slight upwards curve as the price function turned upwards recently. The RSI is trading at index 46 in the lower half of the neutral zone.
Polkadot price analysis conclusion
The Polkadot price analysis shows the coin is under high bearish pressure, though recently some bullish efforts have emerged, bears have already marked a strong downtrend at the very start of the trading session, and bulls don’t seem to have the strength to overturn the trend. As most of the mid-term and the short-term indications are favoring the bears, we expect DOT to continue downside for today.
Disclaimer. The information provided is not trading advice. Cryptopolitan.com holds no liability for any investments made based on the information provided on this page. We strongly recommend independent research and/or consultation with a qualified professional before making any investment decisions.