Binance Coin (BNB) has managed to bounce and hold on above a short-term support level. However, it is showing bearish signs in the long-term.
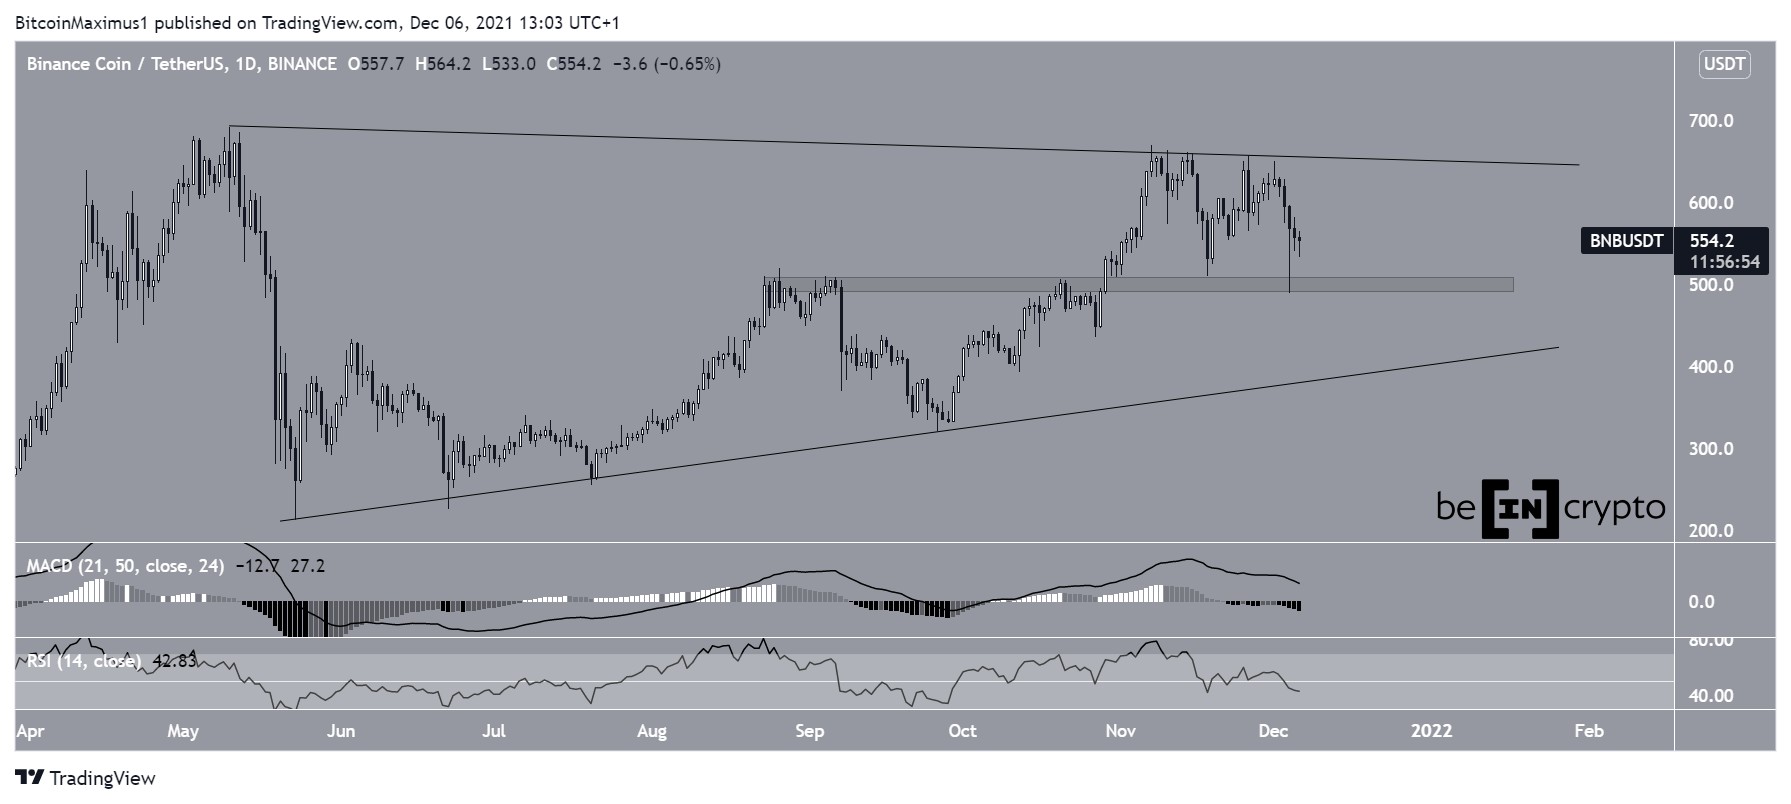
BNB has been moving upwards since May 23. The upward movement continued until Nov 7, when BNB reached a high of $669. The token was rejected afterwards and promptly decreased.
The rejection validated a descending resistance line that has been in place since the May all-time high. Furthermore, it is possible that the token is trading inside a large symmetrical triangle, which is considered a neutral pattern.
After the drop, BNB bounced at the $500 horizontal area, and created a long lower wick. The wick is considered a sign of buying pressure.
However, despite the bounce, technical indicators are bearish.
The MACD, which is created by a short- and long-term moving average, is decreasing. This is a sign that the short-term MA is losing ground relative to the long-term one.
The RSI, which is a momentum indicator, is below 50. The 50 line is considered a benchmark for a bullish/bearish trend, so the decrease below it suggests that the trend is bearish.
Ongoing bounce
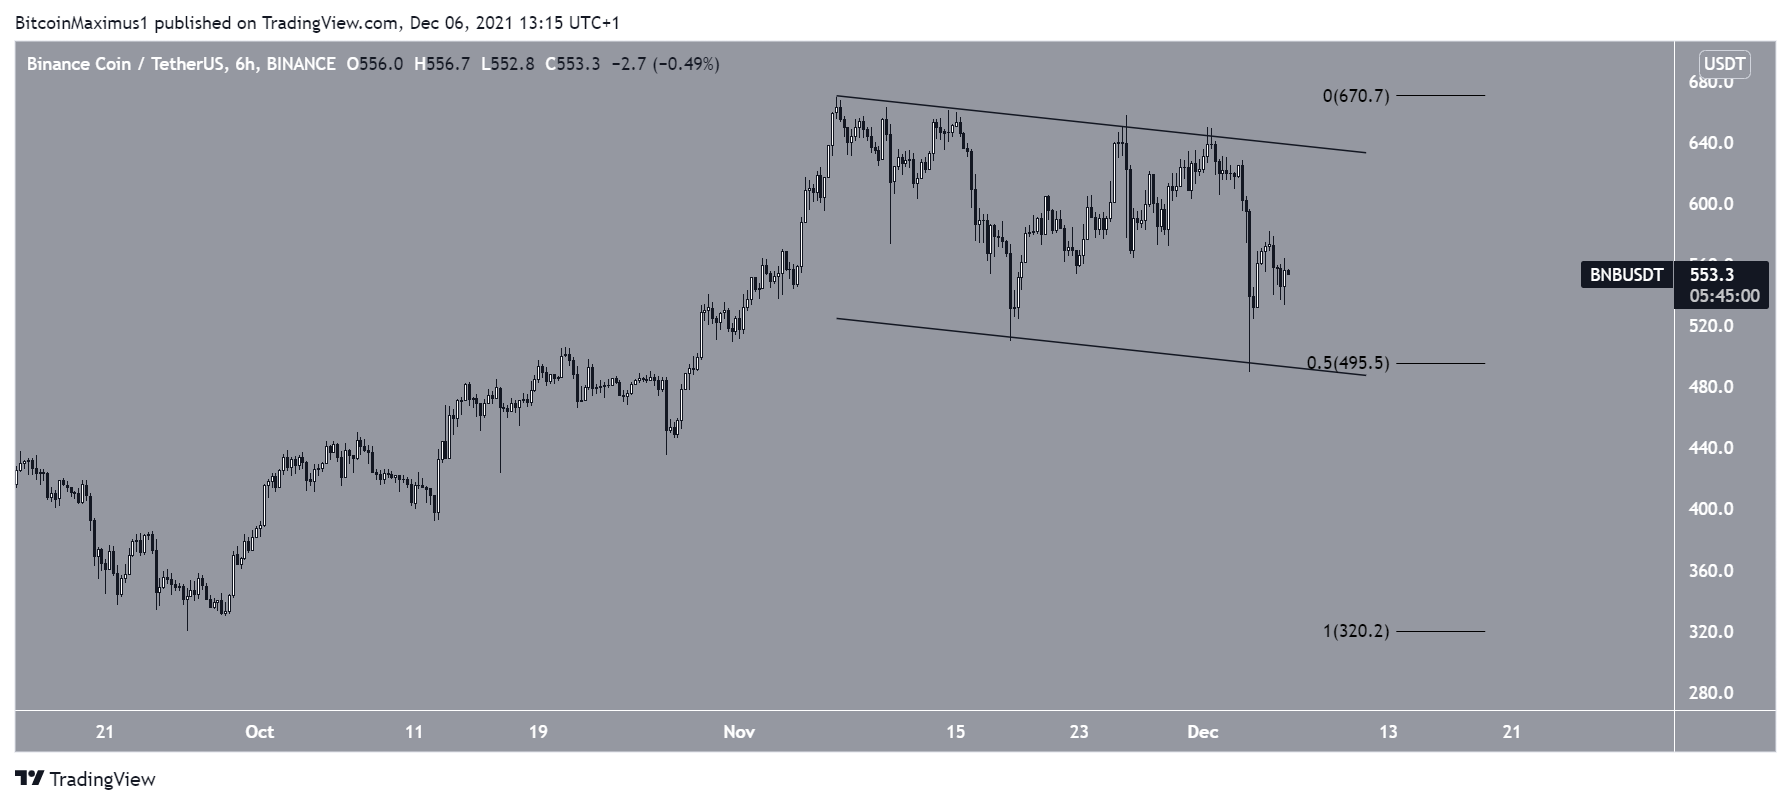
The shorter-term daily chart provides a more bullish outlook.
Firstly, BNB is trading inside a descending parallel channel. Such channels usually contain corrective movements, meaning that a breakout from them would be likely.
Secondly, the bounce occurred at the confluence of both the support line of the channel and the 0.5 Fib retracement support level at $495.5.
Therefore, it is possible that the correction is complete and BNB will eventually break out from the channel.
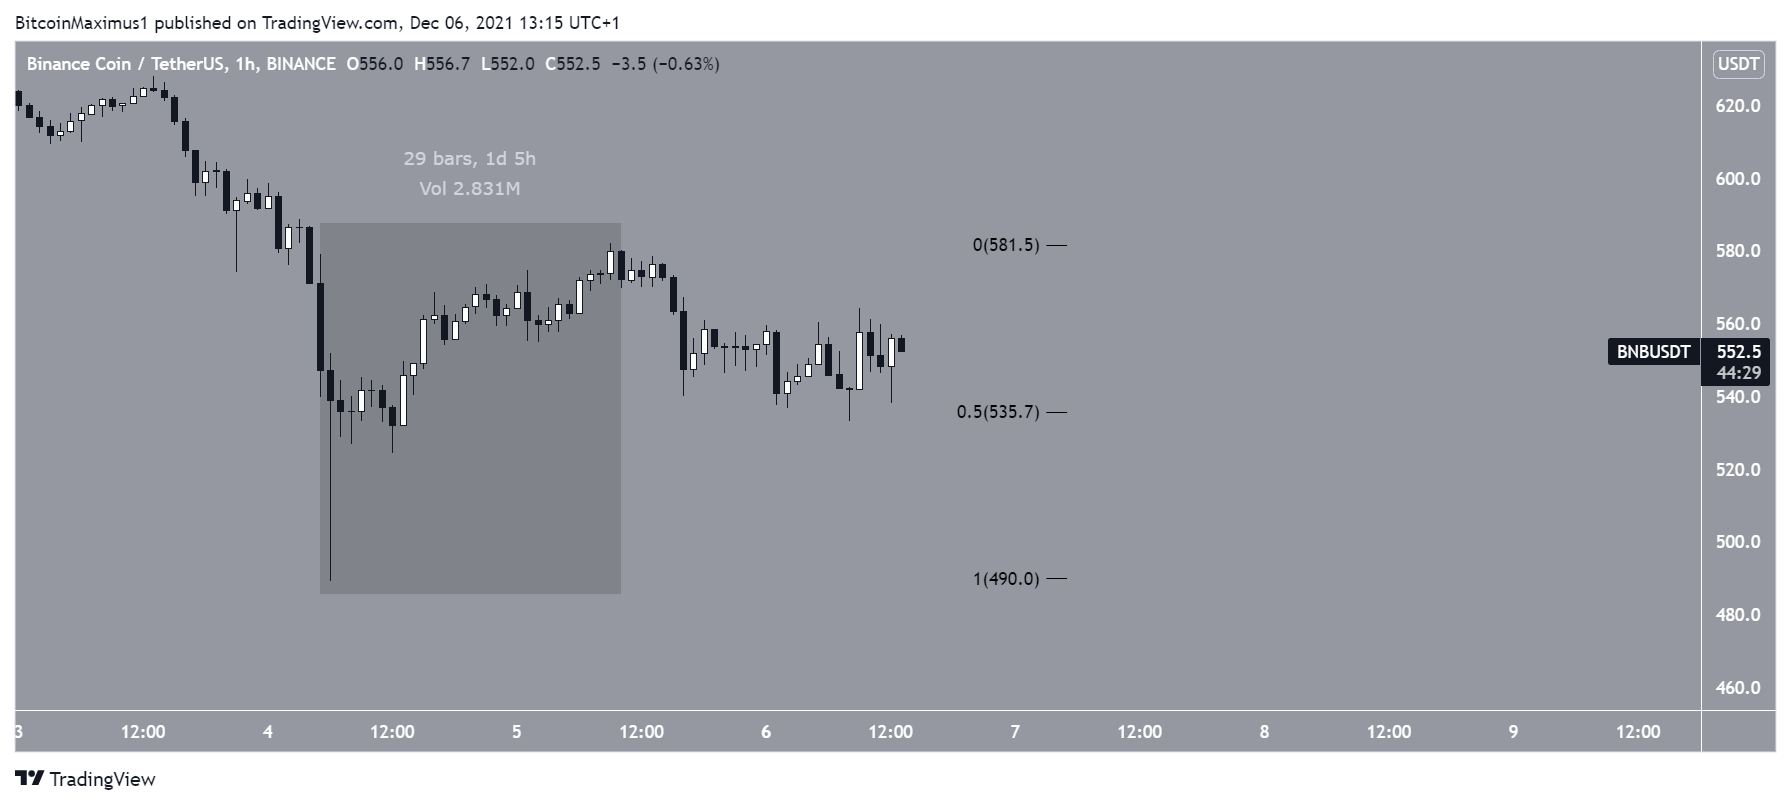
A look at the hourly chart shows that the upward movement on Dec 4 resembles a five wave formation. Therefore, it is likely that the ensuing drop is corrective and BNB will resume its upward movement afterwards.
In order for this to transpire, BNB has to hold on above the short-term 0.5 Fib retracement support level at $535 and create a higher low.
Future BNB movement
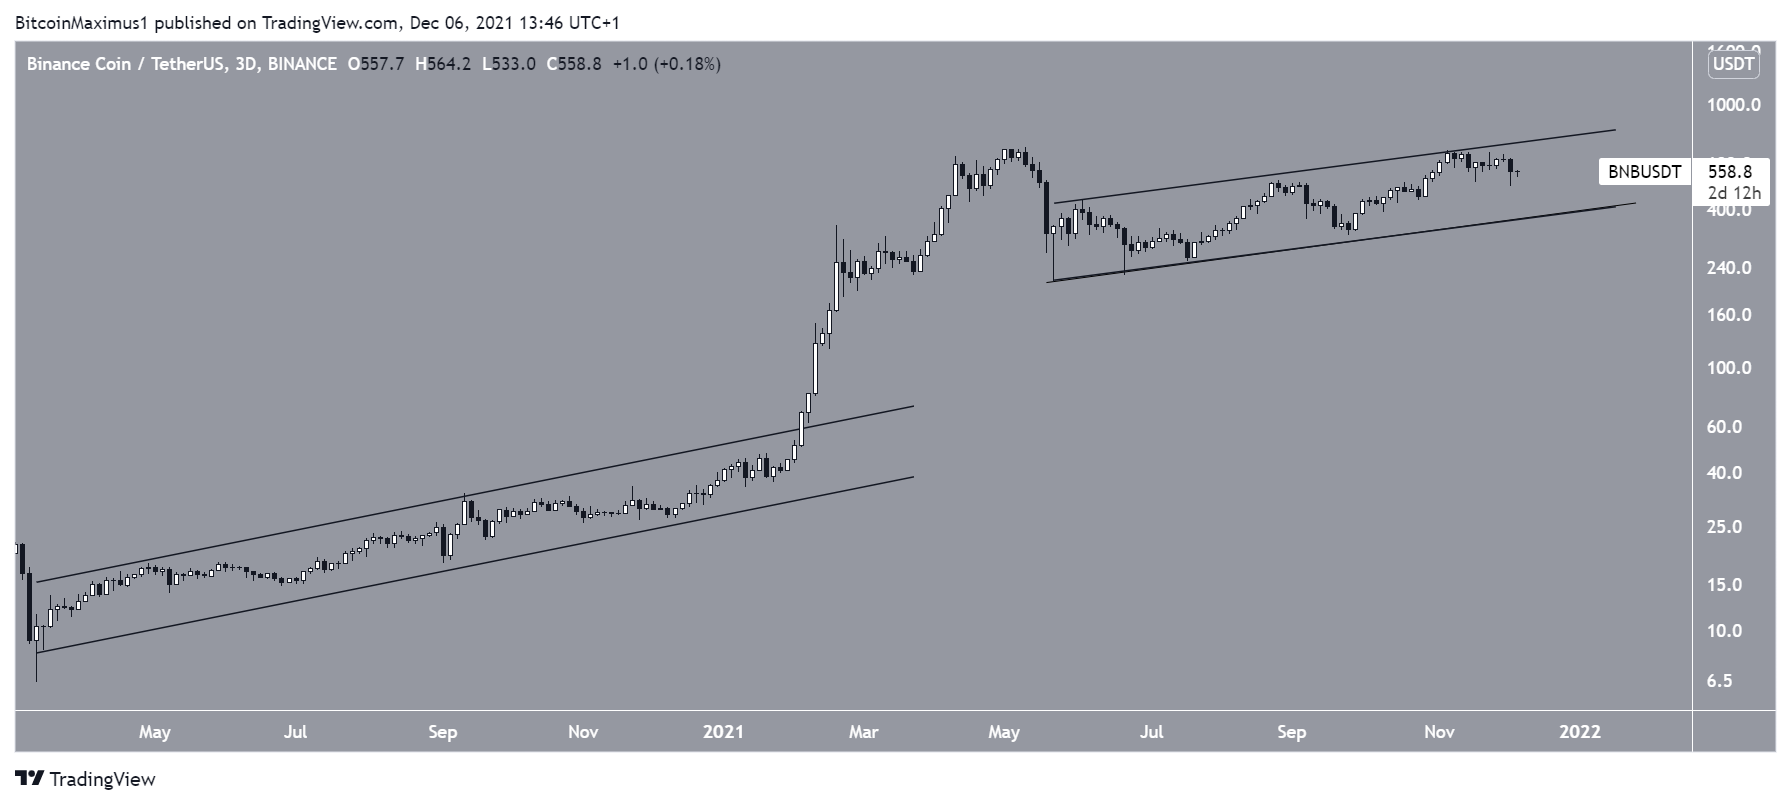
Cryptocurrency analyst @CryptoCapo_ tweeted a BNB fractal, stating that the breakout from the current long-term pattern could trigger a very sharp upward movement.
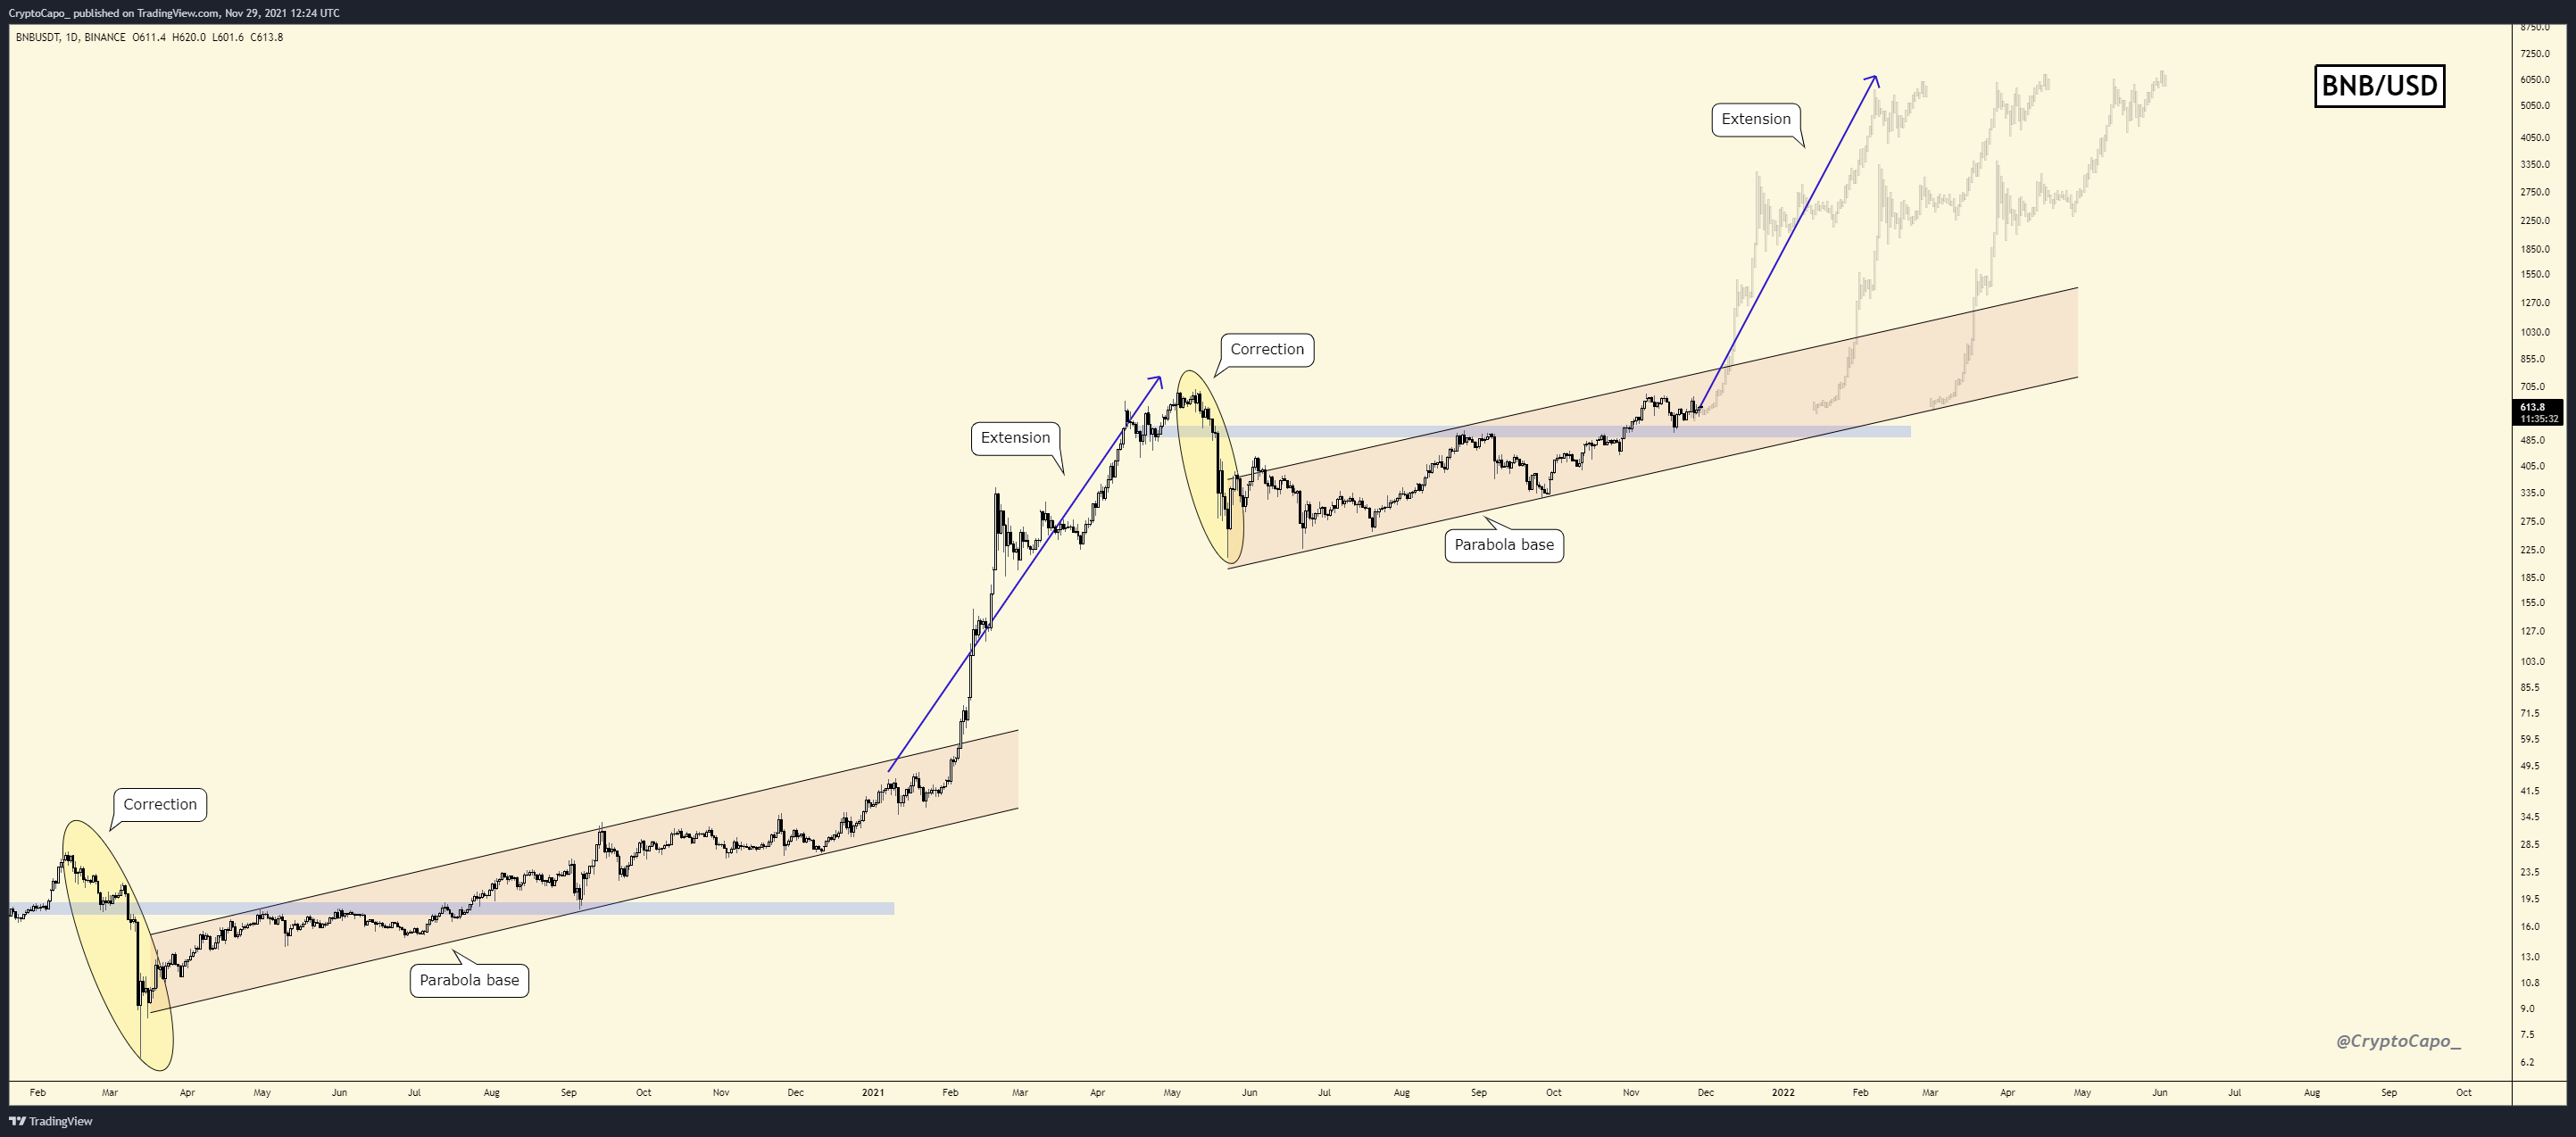
The fractal is visible when looking at the 3-day time-frame in the logarithmic chart.
Initially, BNB traded inside an ascending parallel channel in the period between June 2020 – January 2021. Afterwards, once the token broke out from the channel, the rate of increase greatly accelerated.
Therefore, if BNB can break out from the current channel, a similar increase could potentially follow.